Listen to this Post
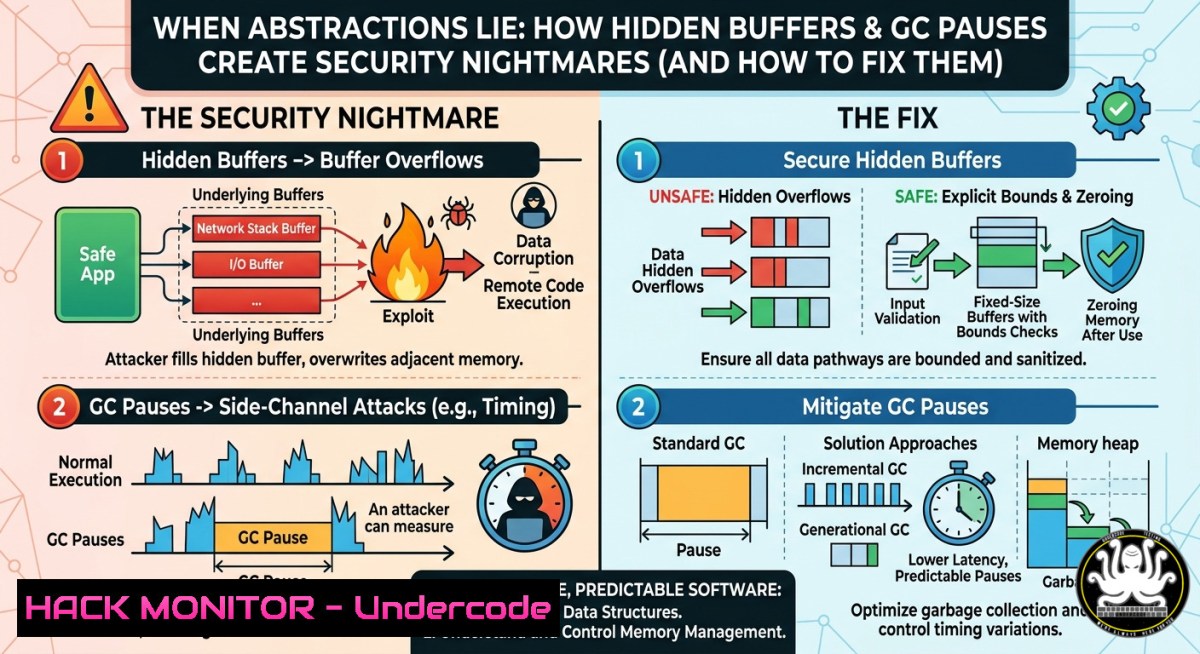
Introduction:
Modern software development relies on powerful abstractions—frameworks, garbage collectors, and dynamic containers—that promise to simplify memory management and performance. But these abstractions inevitably leak, exposing unpredictable latency spikes, hidden buffer bloat, and memory that never returns to the OS. For cybersecurity professionals, such leaks are not mere performance annoyances; they become attack surfaces for denial-of-service (DoS), information disclosure, and even remote code execution when an attacker learns to trigger these hidden behaviors at will.
Learning Objectives:
- Identify common abstraction leaks (dynamic buffers, GC pauses, context-switch overheads) that lead to latency spikes and security vulnerabilities.
- Use Linux/Windows profiling tools (strace, perf, Valgrind, VMMap, eBPF) to detect hidden memory allocation patterns and CPU cache timing leaks.
- Implement mitigations including pre-allocated buffers, secure memory wiping, CPU affinity, and real-time GC tuning to harden systems against abstraction-based exploits.
You Should Know:
- The Hidden Buffer Trap – Detecting and Mitigating Dynamic Memory Bloat
Many high-level frameworks use dynamically growing buffers (e.g., std::vector, ArrayList, or custom ring buffers) that expand on demand but never shrink—even after data is removed. This hidden buffer keeps physical memory hostage, leading to gradual exhaustion and making your service an easy DoS target. An attacker can send periodic large payloads to inflate the buffer, then watch as your service’s memory footprint never recovers.
Step‑by‑step guide to detect and fix:
- On Linux: Attach `strace` to a running process to monitor memory‑related syscalls.
`sudo strace -e mmap,munmap,madvise -p `
Look for repeated `mmap` (growth) without matching `munmap` after processing.
- Use `valgrind –tool=massif` to profile heap usage over time.
`valgrind –tool=massif –time-unit=B ./your_service`
Then analyze with `ms_print massif.out.
- On Windows: Use VMMap (Sysinternals) to watch “Private Bytes” and “Heap” segments. If the heap size stays high after load tests, your buffer is leaking memory back to the OS.
-
Mitigation: Replace dynamic containers with fixed‑size pools or explicitly call `shrink_to_fit()` (C++) or `.trimToSize()` (Java). For custom buffers, implement an upper bound and a periodic “reset” that deallocates and reallocates to force release to the OS.
// Example: manual buffer reset to force munmap
void reset_buffer(char buf, size_t capacity) {
munmap(buf, capacity); // Linux
buf = mmap(NULL, INITIAL_SIZE, PROT_READ|PROT_WRITE, MAP_PRIVATE|MAP_ANONYMOUS, -1, 0);
capacity = INITIAL_SIZE;
}
2. GC Pauses as Denial‑of‑Service Vectors
Garbage collectors (GC) in languages like Java, Go, and C introduce “stop‑the‑world” pauses. Attackers can craft requests that allocate many short‑lived objects, forcing frequent GC cycles and causing latency spikes that degrade service availability. Worse, if an object graph becomes complex, a full GC pause might last seconds—enough to time out all incoming connections.
Step‑by‑step guide to measure and harden:
- In Java: Monitor GC stats in real time.
`jstat -gcutil1000` → Watch `FGC` (full GC count) and `FGCT` (full GC time). A sudden increase indicates possible abuse. -
Simulate an attack: Write a loop that allocates large strings or maps without reuse.
while (true) { map.put(UUID.randomUUID().toString(), new byte[bash]); }
Observe GC frequency with `jconsole` or `VisualVM`.
- Mitigation – Use concurrent GC and object pooling:
- For Java: `-XX:+UseG1GC -XX:MaxGCPauseMillis=50 -XX:G1HeapRegionSize=16M`
- For Go: Set `GOGC=100` (lower = more frequent but shorter pauses) or `debug.SetGCPercent(500)` for larger headroom.
-
Implement object pooling (e.g., `sync.Pool` in Go, Apache Commons Pool in Java) to reduce allocation rates.
-
Windows .NET: Use `dotnet-counters monitor –process-id
System.GC` and `dotnet-gcdump` to collect heap snapshots. Then adjust `gcServer` and `gcConcurrent` flags in runtimeconfig.json.
- Context Switch Overhead and CPU Cache Timing Attacks
Every time a thread yields or a syscall crosses the user‑kernel boundary, a context switch occurs. Attackers can force excessive context switches by abusing epoll/select spurious wake‑ups or by sending many tiny I/O operations. Beyond performance, these forced switches amplify cache side‑channel attacks (e.g., Prime+Probe), where an attacker measures timing differences to infer secret data from shared CPU caches.
Step‑by‑step guide to measure and defend:
- Linux – Count context switches:
`perf stat -e context-switches,cpu-migrations ./your_app`
High context‑switch count (>10k/sec per core) indicates an attack or poor design.
- Trace syscall patterns with `strace -c` – if you see thousands of
epoll_wait,read, or `write` calls per request, batch your I/O. -
CPU cache timing vulnerability demo: Use `cachegrind` (Valgrind tool) to simulate cache misses.
`valgrind –tool=cachegrind ./your_app`
Output shows L1/L2 miss rates—if an untrusted user can control data access patterns, they can perform a Flush+Reload attack.
- Mitigation – Pin threads and batch syscalls:
- Use `taskset` to pin critical threads to specific cores, preventing cache flushes from neighbouring processes.
`taskset -c 2,3 ./your_service`
- In code, use `sched_setaffinity()` to lock thread affinity.
- Reduce syscalls by enabling
SO_REUSEPORT,TCP_CORK, or vectored I/O (readv/writev). - For cloud hardening, enable constant‑time cryptography (e.g., libsodium’s `crypto_verify_16` instead of
memcmp) to eliminate cache‑timing side channels.
4. API Security: When Abstraction Leaks Sensitive Data
High‑level serialization libraries (JSON, Protobuf, XML) often reuse internal buffers to avoid allocations. If those buffers are not zeroed before reuse, leftover data from previous requests can leak into the next user’s response—a classic information disclosure. Similarly, uninitialized reads in C/C++ frameworks can expose heap metadata or other users’ secrets.
Step‑by‑step guide to find and fix memory leaks of sensitive data:
- Detect uninitialized reads with Valgrind:
`valgrind –track-origins=yes ./api_server`
Look for “Conditional jump or move depends on uninitialised value(s)”. The output will point to the exact line where uninitialized memory is used.
- Inspect live buffers with GDB:
Attach to the API process: `gdb -p `
Set breakpoint at serialization function, then examine buffer contents:
`x/100xb
- Mitigation – Explicitly zero buffers before reuse:
// Instead of just clearing length:
void safe_reset(char buf, size_t len) {
explicit_bzero(buf, len); // Linux / BSD – won't be optimized away
// Windows: SecureZeroMemory(buf, len);
}
In Java, use `Arrays.fill(byteArray, (byte)0)` and never rely on `clear()` which may not zero. For Go, use `b = b[:0]` then `for i := range b { b
 = 0 }` before returning to a sync.Pool.</p></li>
<li><p>API hardening: Enforce short‑lived session tokens and never reuse the same buffer object for different users. Use `StringBuilder` in Java with `.delete(0, sb.length())` followed by explicit zeroing via reflection (if absolutely necessary)—or better, allocate fresh buffers for each request in security‑sensitive contexts.</p></li>
</ul>

<ol>
<li>Vulnerability Exploitation: From Latency Spike to Buffer Overflow</li>
</ol>

<p>A buffer that grows dynamically but never shrinks is a prime candidate for off‑by‑one and heap overflow attacks. If the framework uses a custom allocator that mistakes a “capacity” variable, an attacker may be able to overwrite adjacent heap metadata. Even without an overflow, the latency spike can be weaponized: by repeatedly triggering resizes, an attacker induces a systematic slowdown (resource exhaustion) that masks concurrent exploit attempts (e.g., brute‑forcing authentication).

<h2 style="color: yellow;">Step‑by‑step simulation and hardening:</h2>

<ul>
<li>Simulate a “non‑shrinking” buffer in C:
[bash]
char buf = malloc(1024);
strcpy(buf, user_input); // No bounds check – classic overflow
// ... later, the buffer is never reallocated smaller, so capacity stays large.
-
Exploit demo using GDB (for education only):
Compile with `gcc -fno-stack-protector -z execstack -no-pie -o vuln vuln.c`
Feed input larger than buffer size, overwrite return address. Use `pattern create` (Metasploit) to find offset. -
Mitigation – Always use bounds‑checked alternatives:
- Prefer `strlcpy` (BSD) or `strcpy_s` (C11 Annex K) over
strcpy. - In C++ use `std::string` and `.reserve()` to limit growth, plus `at()` for checked access.
- Enable ASLR, stack canaries, and non‑executable stack (default on modern OS).
- For cloud environments, deploy eBPF‑based runtime detection (e.g., Falco) to alert on abnormal buffer realloc patterns.
6. Observability and Continuous Profiling for Proactive Defense
You cannot fix what you cannot see. The best engineers don’t guess where abstractions leak—they instrument every allocation and context switch. Using eBPF (Linux) and Event Tracing for Windows (ETW), you can build a live dashboard that shows when a hidden buffer grows, when GC spikes, or when syscall rates triple. This transforms security from reactive fire‑fighting to threat hunting.
Step‑by‑step setup for continuous monitoring:
- Linux eBPF with bpftrace:
Trace all kernel memory allocations and group by call stack:sudo bpftrace -e 'kprobe:kmalloc { @bytes[bash] = hist(arg1); } kprobe:kfree { @freed[bash] = hist(arg1); }'If `kmalloc` histogram consistently shows large sizes (e.g., >1MB) that are never freed, you’ve found a buffer leak.
-
Monitor context switches per container:
`sudo bpftrace -e ‘kprobe:__schedule { @[bash] = count(); }’`
Set alerts when a single process’s context switches exceed 1000 per second. -
Windows – Use ETW + WPA (Windows Performance Analyzer):
Start a trace: `wpr -start Heap -start VirtualAlloc`
Run your service under load, then wpr -stop trace.etl. Open in WPA, look for “Heap Allocations” → see if virtual memory ever contracts.
- Cloud hardening integration: Export eBPF metrics to Prometheus via
ebpf_exporter. Define SLOs like “no sustained heap growth >5% per minute”. Automatically scale down or rotate pods when anomaly detected (e.g., using Kubernetes HPA on custom memory‑pressure metric).
What Undercode Say:
- Abstractions are attack surfaces in disguise. Every automatic buffer resize, every GC heuristic, every “convenient” thread pool can be turned into a weapon by a knowledgeable adversary. The same dynamic behavior that hides complexity also hides the side effects that lead to DoS and information leaks.
- Low‑level understanding is not optional for security engineers. You cannot defend against buffer‑bloat attacks if you don’t know how `mmap` and `munmap` behave. You cannot mitigate cache‑timing attacks without understanding CPU cache lines. The most valuable skill is knowing exactly where the abstraction breaks—because that’s where the real exploits live.
- Proactive instrumentation beats reactive patching. By embedding eBPF, Valgrind, or ETW into your CI/CD and production pipelines, you turn performance anomalies into early warnings. A sudden spike in `kmalloc` size should be treated like a `SIGSEGV` – a critical event that demands immediate forensic analysis.
Prediction:
Within the next 18 months, we will see a major CVE disclosed that exploits a “hidden buffer” in a popular API gateway or service mesh (e.g., Envoy, NGINX, or a cloud load balancer). The attack will not be a classic overflow but a resource leak through intentional fragmentation—forcing the internal buffer to expand and never shrink, causing memory exhaustion across all tenants in a multi‑tenant cluster. The patch will require rewriting the allocation strategy from dynamic to fixed‑size pools, breaking backward compatibility. After this, cloud providers will mandate budgeted allocations (pre‑declared memory per request) and deprecate “unbounded” abstractions. The industry will finally accept that high‑level safety does not replace low‑level vigilance.
▶️ Related Video (74% Match):
🎯Let’s Practice For Free:
IT/Security Reporter URL:
Reported By: Maximilianfeldthusen Debugging – Hackers Feeds
Extra Hub: Undercode MoN
Basic Verification: Pass ✅
🎓 Live Courses & Certifications:
Join Undercode Academy for Verified Certifications
🚀 Request a Custom Project:
Secure, high-velocity infrastructure and disruptive technological engineering. Contact our engineering team for high-tier development and proprietary systems:
[email protected]


