Listen to this Post
Introduction:
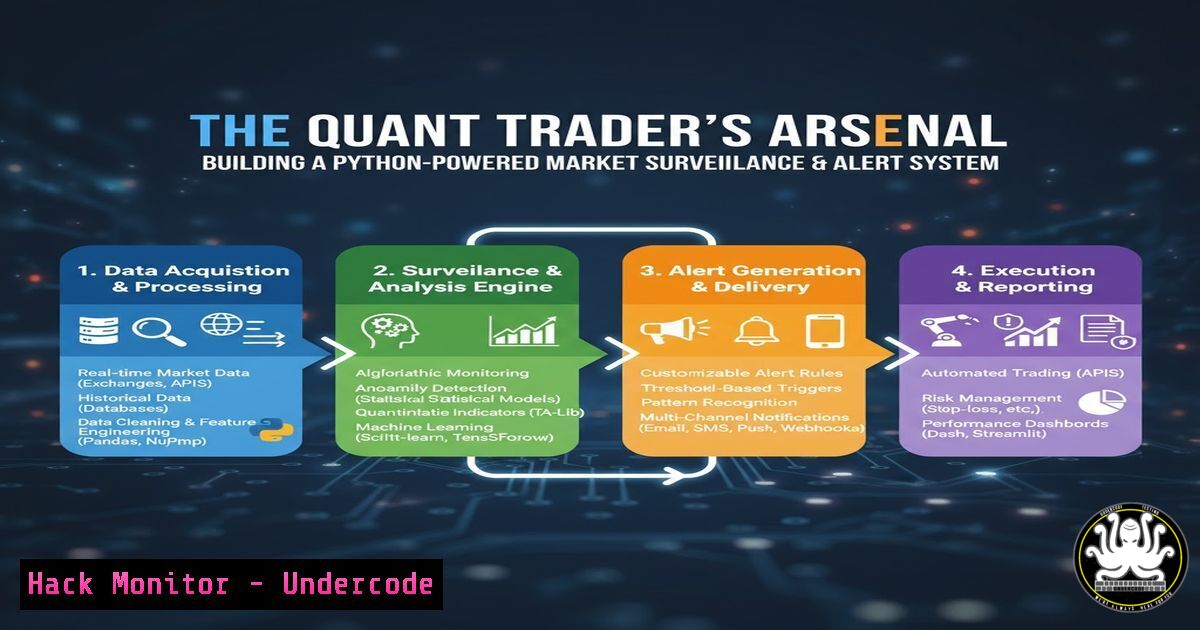
The convergence of finance and technology has democratized access to sophisticated trading surveillance tools once reserved for institutional firms. By leveraging Python, Yahoo Finance data, and technical analysis, individual traders can now construct automated systems to monitor positions, enforce disciplined risk management through trailing stops, and receive timely alerts on critical market movements. This guide deconstructs the core components of such a system, providing the technical commands and code to build your own market sentinel.
Learning Objectives:
- Master the Python libraries and APIs for fetching and manipulating financial data.
- Implement technical indicators like SMA and ATR to automate trading signals and risk management.
- Build a persistent state mechanism and automated alerting system for continuous, unattended operation.
You Should Know:
1. Foundations: Fetching and Parsing Financial Data
To build any market surveillance tool, you must first reliably acquire data. The `yfinance` library is a popular Python interface to Yahoo Finance.
import yfinance as yf
import pandas as pd

Fetch historical data for a symbol (e.g., RR.L)
symbol = "RR.L"
data = yf.download(symbol, period="6mo", interval="1d")

Display the last few rows of the DataFrame
print(data.tail())

Calculate a simple moving average (SMA) over 50 days
data['SMA50'] = data['Close'].rolling(window=50).mean()
print(data[['Close', 'SMA50']].tail())
Step-by-step guide: This code block is the foundation. First, it imports the necessary libraries. `yf.download()` fetches six months of daily data. The returned `data` is a Pandas DataFrame containing Open, High, Low, Close, and Volume (OHLCV) data. The subsequent line calculates the 50-day Simple Moving Average by taking the rolling mean of the ‘Close’ price and stores it in a new column. Running this script will print the latest price and its corresponding 50-day SMA, allowing you to verify the data pipeline is working.
2. Core Risk Management: Implementing the Trailing Stop
A trailing stop that uses Average True Range (ATR) adapts to market volatility. This is more robust than a fixed-percentage stop.
import json

Calculate ATR (14-period)
def calculate_atr(data, period=14):
high_low = data['High'] - data['Low']
high_close = (data['High'] - data['Close'].shift()).abs()
low_close = (data['Low'] - data['Close'].shift()).abs()
true_range = pd.concat([high_low, high_close, low_close], axis=1).max(axis=1)
atr = true_range.rolling(window=period).mean()
return atr

data['ATR14'] = calculate_atr(data)
data['Trailing_Stop'] = data['Close'] - (5  data['ATR14'])

Persist the trailing stop to a state file
state = {'trailing_stop': data['Trailing_Stop'].iloc[-1]}
with open('state.json', 'w') as f:
json.dump(state, f)

print(f"Current Close: {data['Close'].iloc[-1]:.2f}")
print(f"Calculated Trailing Stop: {data['Trailing_Stop'].iloc[-1]:.2f}")
Step-by-step guide: This code defines a function to calculate the 14-period ATR, which measures market volatility. It then creates a trailing stop level by subtracting five times the ATR from the closing price. This stop level will rise with the price but will not fall, locking in profits. The critical part is saving this stop level to state.json. This persistence ensures that the stop-loss level survives between script executions, a key feature for a daily updater.
3. Automating Signal Generation with Conditional Logic
Automation requires translating trading rules into conditional statements that trigger alerts or actions.
 Initialize or load alert state
try:
with open('alerts_state.json', 'r') as f:
alert_state = json.load(f)
except FileNotFoundError:
alert_state = {'prudence_count': 0, 'last_review': None}

current_close = data['Close'].iloc[-1]
current_volume = data['Volume'].iloc[-1]
avg_volume = data['Volume'].tail(20).mean()

Rule 1: "Prudence" alert for SMA50 break
if current_close < data['SMA50'].iloc[-1]:
alert_state['prudence_count'] += 1
else:
alert_state['prudence_count'] = 0

if alert_state['prudence_count'] >= 3:
alert_msg = f"ALERT: Prudence - Close below SMA50 for 3 sessions. Price: {current_close:.2f}"
print(alert_msg)
with open('alerts.txt', 'a') as f:
f.write(alert_msg + "\n")

Rule 2: "Reinforce" alert for price/volume breakout
if current_close > 1160 and current_volume > avg_volume:
alert_msg = f"ALERT: Reinforce - Price > 1160 with high volume. Price: {current_close:.2f}"
print(alert_msg)
with open('alerts.txt', 'a') as f:
f.write(alert_msg + "\n")

Save the updated alert state
with open('alerts_state.json', 'w') as f:
json.dump(alert_state, f)
Step-by-step guide: This segment introduces stateful alerting. It loads a previous state to track how many consecutive days the price has been below the SMA50. If this count reaches three, it triggers a “Prudence” alert and logs it to alerts.txt. Simultaneously, it checks for a “Reinforce” signal based on price and volume. By saving the `alert_state` back to a file, the script maintains memory of these conditions across daily runs.
4. Data Visualization: Generating a Persistent Chart
Visual feedback is crucial. Using matplotlib, we can generate a chart that includes price, indicators, and the trailing stop.
import matplotlib.pyplot as plt

plt.figure(figsize=(12, 8))
plt.plot(data.index, data['Close'], label='Close Price', linewidth=2)
plt.plot(data.index, data['SMA50'], label='50-Day SMA', linestyle='--')
plt.plot(data.index, data['Trailing_Stop'], label='Trailing Stop', linestyle=':')
plt.title(f'{symbol} Price Chart with Indicators')
plt.legend()
plt.grid(True)
plt.xticks(rotation=45)
plt.tight_layout()
plt.savefig(f'{symbol}_chart.png')  Saves the chart as a PNG file
print("Chart saved as 'RR.L_chart.png'")
Step-by-step guide: This code uses `matplotlib` to create a professional-looking chart. It plots three lines: the closing price, the 50-day SMA, and the dynamic trailing stop. The `plt.savefig()` function is key here, as it writes the chart to a PNG file on disk. This allows the chart to be viewed later or integrated into a GUI or report, providing a visual history of the security’s performance and the system’s logic.
5. Scheduling for Unattended Operation with System Schedulers
For the script to run daily at a specific time (e.g., 23:00), you can use the system’s native scheduler instead of relying on a Python loop, which is more robust.
For Linux/macOS (Cron):
 Open the crontab editor
crontab -e

Add the following line to run the script daily at 23:00
0 23    /usr/bin/python3 /path/to/your/script.py
For Windows (Task Scheduler via Command Line):
 Create a new task (run Command Prompt as Administrator)
schtasks /create /tn "MarketSurveillance" /tr "C:\Python39\python.exe C:\path\to\your\script.py" /sc daily /st 23:00
Step-by-step guide: These commands move the automation from the script to the operating system. On Linux/macOS, you edit the user’s cron table to execute the Python script every day at 23:00. On Windows, you use the `schtasks` command to create a scheduled task that does the same. This method ensures the script runs reliably even if the machine is restarted, making the entire surveillance system truly hands-off.
What Undercode Say:
- Democratization of Quantitative Tools: The barrier to entry for systematic trading and risk management is collapsing. A single developer with Python knowledge can now replicate core functionalities of multi-million dollar trading desks.
- The Criticality of State Persistence: The most sophisticated trading logic is useless if it can’t remember its state between runs. The use of simple JSON files for storing trailing stops and alert counters is a pragmatic and effective solution for persistence in low-frequency applications.
The system described represents a significant shift in the trading landscape. It’s not about high-frequency algos, but about disciplined, rules-based investing for the retail trader. The real “hack” here is the encoding of emotional discipline—like not moving a stop-loss—into immutable code. This prevents the common pitfall of emotional decision-making during market volatility. However, it also introduces a new class of risks: over-reliance on a single data source (Yahoo Finance) and potential logical errors in the code itself, which could lead to catastrophic, automated losses. The system’s security is paramount; an attacker gaining access could manipulate the state files or the script to trigger erroneous trades.
Prediction:
The proliferation of such accessible, code-driven trading systems will lead to a new wave of “retail quant” traders, increasing market efficiency but also potentially correlating strategies based on similar public code templates. In the future, we will see AI not just monitoring pre-set rules, but dynamically optimizing these rules based on changing market regimes. Furthermore, this trend will attract more sophisticated cyber threats, targeting these personal trading bots to either steal strategies, manipulate their behavior for market advantage, or hold their operation for ransom, making security hardening as important as the trading logic itself.
🎯Let’s Practice For Free:
IT/Security Reporter URL:
Reported By: Dr Philippe – Hackers Feeds
Extra Hub: Undercode MoN
Basic Verification: Pass ✅


