
Listen to this Post
Introduction:
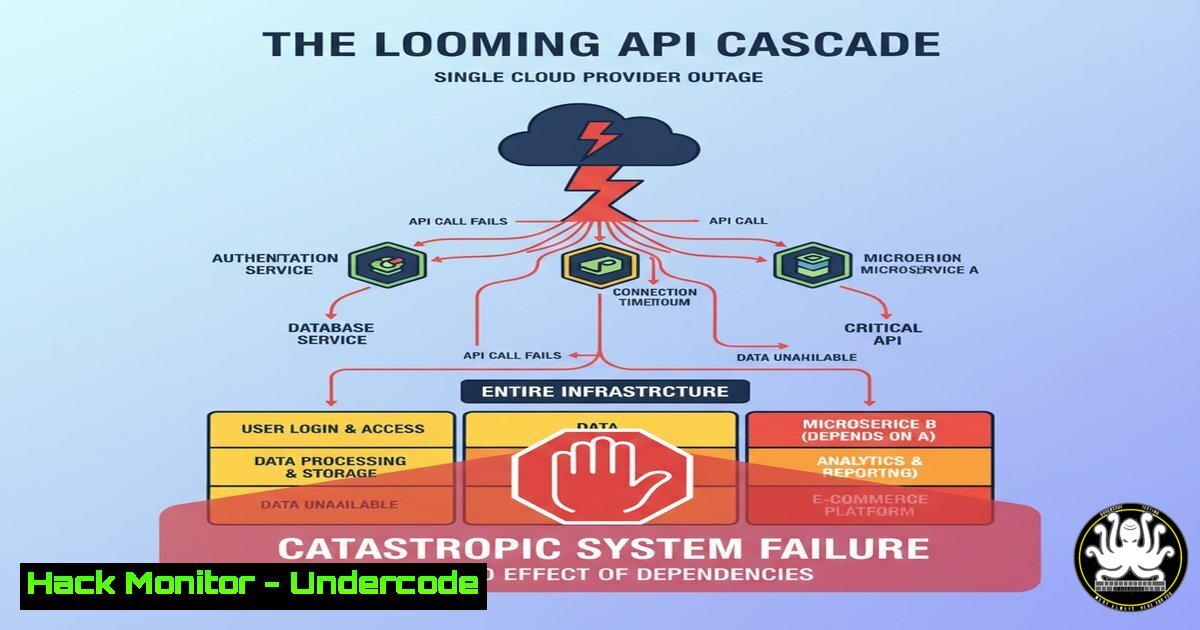
Recent, simultaneous outages across major cloud and AI providers have exposed a critical vulnerability in our interconnected digital ecosystem: systemic API fragility. These are not isolated incidents but rather cascading failures stemming from shared dependencies and inadequate isolation, highlighting an urgent need for robust resilience strategies.
Learning Objectives:
- Understand the root causes and propagation mechanisms of API cascade failures.
- Implement practical commands and configurations to harden your API infrastructure against systemic risks.
- Develop a proactive monitoring and incident response plan for multi-cloud API dependencies.
You Should Know:
1. Mapping Your API Dependency Graph
Before you can defend your infrastructure, you must understand its connections. The following commands help map internal and external API dependencies.
`nmap -sS –script http-enum,ssl-cert -p 80,443,8000-9000 `
This Nmap command performs a SYN scan (-sS) on common web service ports and runs scripts to enumerate HTTP services and retrieve SSL certificates. It helps identify active API endpoints and their security posture.
Step-by-step guide:
- Install Nmap from the official website or your package manager (
sudo apt-get install nmap). - Replace `
` with your target domain or IP range (e.g., `api.yourcompany.com` or 192.168.1.0/24). - Run the command. The output will list open ports and detailed information about discovered HTTP/HTTPS services, revealing potential API gateways and backend services you depend on.
`curl -H “Authorization: Bearer
This command tests your consumption and limits of an external API, a critical factor during provider instability.
Step-by-step guide:
- Obtain a valid API token or key from the service provider (e.g., GitHub, AWS, Azure).
2. Replace `` with your actual authentication token.
- Execute the command. The response will show your current rate limit usage, helping you anticipate and manage throttling during external API stress.
2. Hardening API Gateway Configurations
A misconfigured gateway is a primary failure point. These commands help enforce strict policies.
`aws apigateway update-stage –rest-api-id
This AWS CLI command sets a hard rate limit on a specific API Gateway stage to prevent it from being overwhelmed by traffic spikes, a common symptom of cascading failures.
Step-by-step guide:
- Ensure the AWS CLI is installed and configured with appropriate credentials (
aws configure). - Identify your REST API ID and stage name from the AWS API Gateway console.
- Replace `
` and ` ` with your values. The `value=’1000’` sets the limit to 1000 requests per second; adjust based on your capacity. - Run the command to apply the throttling setting, protecting your backend from traffic surges.
`kubectl get ingress -n
-o yaml | grep -A 10 -B 10 “nginx.ingress.kubernetes.io/limit-rps”`
For Kubernetes environments, this command checks existing rate-limiting annotations on Ingress resources, which are crucial for controlling inbound API traffic.
Step-by-step guide:
- Have `kubectl` configured with access to your cluster.
- Replace `
` with the relevant Kubernetes namespace (use `–all-namespaces` for a cluster-wide check). - The command fetches all Ingress manifests in YAML format and uses `grep` to find lines related to RPS (Requests Per Second) limiting, showing you the current configuration.
3. Implementing Circuit Breakers with Service Mesh
Circuit breakers prevent your services from repeatedly calling failing upstream APIs, a key tactic to halt cascade propagation.
`istioctl analyze -n `
This command analyzes your Istio service mesh configuration for potential misconfigurations, including missing circuit breakers.
Step-by-step guide:
1. Install and configure the `istioctl` command-line tool.
- Run the command, specifying a namespace. It will output warnings and errors related to your Istio resources.
- Look for recommendations related to DestinationRules, which is where circuit breakers are defined.
<
h2 style=”color: yellow;”>kubectl apply -f - <<EOF</h2>
<h2 style="color: yellow;">apiVersion: networking.istio.io/v1alpha3</h2>
<h2 style="color: yellow;">kind: DestinationRule</h2>
<h2 style="color: yellow;">metadata:</h2>
<h2 style="color: yellow;">name: api-backend</h2>
<h2 style="color: yellow;">spec:</h2>
<h2 style="color: yellow;">host: api.backend.svc.cluster.local</h2>
<h2 style="color: yellow;">trafficPolicy:</h2>
<h2 style="color: yellow;">connectionPool:</h2>
<h2 style="color: yellow;">tcp:</h2>
<h2 style="color: yellow;">maxConnections: 100</h2>
<h2 style="color: yellow;">http:</h2>
<h2 style="color: yellow;">http1MaxPendingRequests: 50</h2>
<h2 style="color: yellow;">maxRequestsPerConnection: 10</h2>
<h2 style="color: yellow;">outlierDetection:</h2>
<h2 style="color: yellow;">consecutive5xxErrors: 5</h2>
<h2 style="color: yellow;">interval: 30s</h2>
<h2 style="color: yellow;">baseEjectionTime: 60s</h2>
<h2 style="color: yellow;">maxEjectionPercent: 50</h2>
<h2 style="color: yellow;">EOF
This `kubectl` command applies a YAML manifest that defines an Istio DestinationRule, implementing a circuit breaker for the `api-backend` service.
Step-by-step guide:
1. Copy the entire block of YAML code.
- Ensure you are in the correct Kubernetes context and namespace.
- Paste and run the entire command. It creates a DestinationRule that limits concurrent connections and pending requests, and ejects the service instance from the load balancing pool after 5 consecutive 5xx errors.
4. Proactive Failure Injection via Chaos Engineering
To build resilience, you must test for failure. Chaos engineering tools allow you to safely simulate API outages.
`kubectl apply -f https://hub.litmuschaos.io/api/chaos/2.14.0?file=charts/generic/pod-delete/experiment.yaml`
This command installs a LitmusChaos experiment for pod deletion, simulating the sudden failure of a microservice that provides an API.
Step-by-step guide:
1. Ensure LitmusChaos is installed in your Kubernetes cluster.
2. Run this command to apply the experiment manifest. This does not run the experiment immediately.
3. To trigger the experiment, you must create a ChaosEngine resource that references this experiment and specifies the target application. This controlled test validates if your circuit breakers and retry logic work as intended.
`docker run -it –rm -v $(pwd):/var/run -p 8500:8500 alaz/demo:chaos-http-proxy`
This Docker command runs a chaos HTTP proxy, which can be configured to inject latency, errors, and faults into HTTP API calls between containers for testing.
Step-by-step guide:
1. Ensure Docker is running on your machine.
- Run the command. It pulls the `alaz/demo:chaos-http-proxy` image and starts a container.
- Configure your application to route its HTTP traffic through this proxy (e.g., `http://localhost:8500`). You can then use the proxy’s API to dynamically inject failures like 500 errors or 2-second delays.
5. Advanced API Traffic Monitoring and Anomaly Detection
Detecting the early signs of a cascade is critical for triggering failover mechanisms.
`tcpdump -i any -s 0 -A ‘tcp port 443 and (tcp[((tcp[12:1] & 0xf0) >> 2):4] = 0x504f5354)’`
This advanced `tcpdump` command captures and displays the body of HTTPS POST requests on port 443. Warning: Use only on systems you own and for debugging purposes, as it may capture sensitive data.
Step-by-step guide:
- Run with `sudo` privileges as packet capture requires root access.
- The filter `’tcp port 443 and (tcp[((tcp[12:1] & 0xf0) >> 2):4] = 0x504f5354)’` is designed to match the ASCII characters ‘POST’ in the TCP payload, identifying POST requests.
- Analyze the output to see the raw API traffic, which can help identify unusual payloads or traffic patterns from a distressed upstream provider.
`promtool query series –start=$(date -d ‘1 hour ago’ +%s) –end=$(date +%s) ‘api_http_requests_total{code=~”5..”}’ http://your-prometheus:9090`
This command queries a Prometheus monitoring server for all API HTTP 5xx errors in the last hour, a key metric for detecting backend instability.
Step-by-step guide:
- Ensure `promtool` is installed and you have network access to your Prometheus server.
- Replace `http://your-prometheus:9090` with your Prometheus server’s URL.
- The query `api_http_requests_total{code=~”5..”}` uses a regular expression to match any status code in the 500 range. A sudden spike in the results is a major red flag.
6. Cloud-Specific CLI Commands for Incident Response
When an outage occurs, you need to quickly assess the health of your cloud services.
`aws cloudwatch describe-alarms –state-value ALARM –output table`
This AWS CLI command lists all CloudWatch alarms that are currently in the ALARM state, providing a quick dashboard of active issues in your AWS environment.
Step-by-step guide:
- Run with AWS credentials that have read access to CloudWatch.
- The `–output table` flag formats the output in a readable table. Scan the output for alarms related to API Gateway latency, Lambda errors, or EC2 instance health.
`az monitor metrics list –resource /subscriptions/
/resourceGroups/ /providers/Microsoft.ApiManagement/service/ –metric Requests –interval PT1M –start-time 2024-06-19T00:00:00Z –end-time 2024-06-19T23:59:59Z`
This Azure CLI command retrieves minute-level request metrics for an API Management service, allowing for granular analysis of API traffic during a suspected incident.
Step-by-step guide:
1. Authenticate with the Azure CLI (`az login`).
- Replace
<sub-id>,<rg-name>, and `` with your specific Azure resource identifiers. - Adjust the `–start-time` and `–end-time` parameters to the relevant period. A sudden drop or spike in the `Requests` metric can confirm external reports.
7. DNS-Level Resilience with Health Checks and Failover
When an API’s primary endpoint fails, DNS failover can redirect traffic to a healthy region or static failure page.
`dig +short google.com A`
The `dig` command is a fundamental tool for querying DNS information. This simple example retrieves the A records for a domain.
Step-by-step guide:
1. Open a terminal.
2. Run `dig +short A`.
- During an incident, run this command repeatedly. If you have DNS failover configured, you should eventually see the IP address change from the primary endpoint to the secondary, healthy endpoint.
`aws route53 change-resource-record-sets –hosted-zone-id –change-batch file://failover.json`
This command instructs AWS Route53 to update a DNS record based on a health check, triggering a failover.
Step-by-step guide:
- First, create a `failover.json` file that defines the new record set (e.g., pointing to a static S3 bucket with an outage message).
- Replace `
` with your Route53 hosted zone ID. - Run the command. This is a powerful, destructive command that should be part of a pre-approved and tested runbook for major incidents.
What Undercode Say:
- Systemic Risk is the New Normal. The interlinking of cloud providers, CDNs, and identity platforms through shared underlying infrastructures means that a single provider’s “isolated” incident can and will trigger a domino effect. Organizations can no longer operate on the assumption that multi-cloud is a guaranteed redundancy strategy by itself.
- Proactive Chaos Engineering is Non-Negotiable. Relying on theoretical failovers is a recipe for disaster. The only way to truly trust your resilience is to regularly, and in a controlled manner, break your own dependencies in pre-production and eventually production environments. This validates your monitoring, circuit breakers, and runbooks.
The recent outages are not anomalies but stress tests of a deeply coupled system. The industry’s focus must shift from pure outage avoidance to designing for graceful degradation and rapid recovery. This involves architectural patterns like bulkheads, backpressure management, and dependency isolation, which are more critical than ever. The commands and configurations provided are the practical starting points for this necessary evolution.
Prediction:
The frequency and scope of these API cascade failures will intensify over the next 18-24 months, driven by increased adoption of AI-as-a-Service and serverless architectures, which introduce even more opaque, third-party dependencies. This will force a fundamental shift in cloud contracts, with SLAs evolving to include liability for downstream business impacts and a new market for “cascade-resistant” infrastructure design and auditing will emerge.
🎯Let’s Practice For Free:
IT/Security Reporter URL:
Reported By: Unitedstatesgovernment Cloudsecurity – Hackers Feeds
Extra Hub: Undercode MoN
Basic Verification: Pass ✅


