Listen to this Post
Introduction:
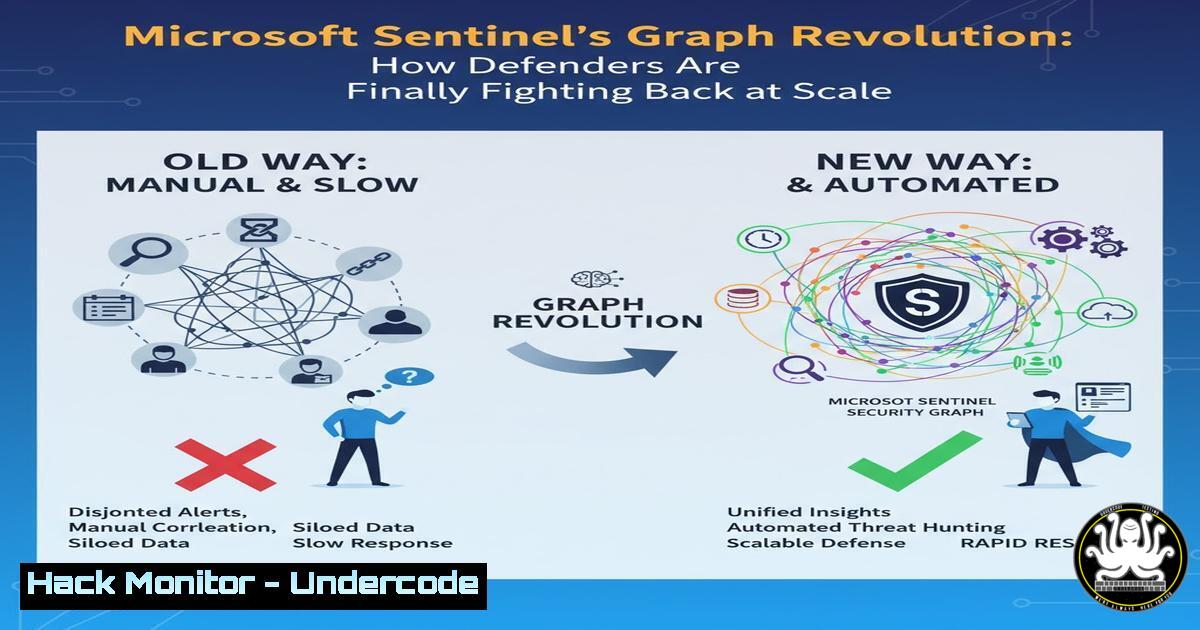
For decades, attackers have leveraged graph theory to map and exploit relationships within networks for lateral movement. Microsoft Sentinel’s new Graph feature aims to level the playing field, providing defenders with a powerful, scalable platform to visualize, analyze, and disrupt these attack chains. This represents a fundamental shift from reactive alerting to proactive, relationship-based security analysis.
Learning Objectives:
- Understand the core concepts of graph theory in cybersecurity and how attackers exploit relationship graphs.
- Learn how to deploy and configure Microsoft Sentinel’s Graph feature for enterprise-scale defense.
- Acquire practical command-line and KQL skills to model, query, and investigate attack paths within your environment.
You Should Know:
- Understanding the Attacker’s Graph: Mapping Lateral Movement Paths
Attackers don’t see individual machines; they see a graph of relationships—user accounts, group memberships, trust relationships, and service principals. Tools like BloodHound automatically map these graphs to find the most efficient path to domain dominance.
Verified Command: Running BloodHound Collector on a Domain-Joined Host
 On a domain-joined machine with SharpHound ingestor:
SharpHound.exe --CollectionMethod All --Domain corp.local --ZipFileName loot.zip
Step-by-step guide:
- Download the SharpHound ingestor from the BloodHound GitHub repository.
- Execute the command from a command prompt with necessary domain permissions.
- The `–CollectionMethod All` flag gathers data on sessions, groups, trusts, and ACLs.
- The tool outputs a `loot.zip` file, which is the graph data of your Active Directory environment that you can import into the BloodHound UI for analysis. This demonstrates the exact graph structure attackers see and exploit.
-
Activating and Accessing the Microsoft Sentinel Graph Feature
Before you can defend with graphs, you must enable the feature within your Sentinel workspace. This is managed via Azure CLI or PowerShell.
Verified Azure CLI Command: Enable Microsoft Sentinel
 Ensure the Microsoft.SecurityInsights resource provider is registered
az provider register --namespace 'Microsoft.SecurityInsights'

Enable Sentinel on a specific Log Analytics Workspace
az securityinsights sentinel setting create --name "default" --resource-group "MyResourceGroup" --workspace-name "MyWorkspace" --enabled true
Step-by-step guide:
1. Authenticate to Azure using `az login`.
- Register the required resource provider to ensure the features are available in your subscription.
- The final command explicitly enables Microsoft Sentinel on your chosen Log Analytics workspace, which is a prerequisite for accessing the Graph interface. Navigate to your Sentinel resource in the Azure portal to find the new Graph blade.
-
Ingesting Data for Graph Analysis: The Role of the Azure Monitor Agent
A graph is only as good as its data. The Azure Monitor Agent (AMA) is the primary method for collecting security logs from virtual machines and sending them to your Log Analytics workspace, which feeds the Graph.
Verified PowerShell Command: Install Azure Monitor Agent on Windows
 Download and install the AMA deployment script
Invoke-WebRequest -Uri "https://aka.ms/azmonagentwindows" -OutFile "AMAAgentInstaller.ps1"
 Execute the installation script
.\AMAAgentInstaller.ps1 -WorkspaceId "<YourWorkspaceId>" -WorkspaceKey "<YourWorkspaceKey>"
Step-by-step guide:
- Run this script in an elevated PowerShell session on the target Windows machine.
- Replace `
` and ` ` with the values from your Log Analytics workspace (found under Agents > Log Analytics agent instructions). - This installs the agent and begins streaming Windows Event Logs and other specified data sources to your Sentinel workspace, populating the entities and relationships that the Graph model uses.
-
Building Your First Custom Graph Query with KQL
While Sentinel provides built-in graph analytics, custom Kusto Query Language (KQL) queries are essential for hunting specific threats. This query finds processes running under a user context that has recently been added to a privileged group—a common persistence and escalation technique.
Verified KQL Query: Hunt for Recent Privilege Escalation
SecurityEvent
| where EventID == 4732 // A member was added to a security-enabled local group
| where TargetAccount endswith "Domain Admins" // Focus on critical groups
| project TimeGenerated, TargetUserName, MemberName, SubjectUserName
| join kind=inner (
SecurityEvent
| where EventID == 4688 // A new process has been created
| project ProcessCreationTime=TimeGenerated, Account=SubjectUserName, Process=NewProcessName
) on $left.MemberName == $right.Account
| where ProcessCreationTime > TimeGenerated // Process run after group addition
| project ProcessCreationTime, PrivilegedAccount=MemberName, Process, AddedBy=SubjectUserName
Step-by-step guide:
- Navigate to the Logs blade in your Sentinel or Log Analytics workspace.
- Paste this KQL query into the query editor.
- The query first identifies group membership changes (
EventID 4732) into “Domain Admins.” - It then performs an inner join with process creation events (
EventID 4688) to find any processes launched by that newly privileged user. - The results show potential evidence of an attacker using their newly granted privileges, creating a clear relationship link for your graph investigation.
5. Hardening Service Principal Relationships in Azure AD
In cloud environments, service principals (identities for applications and services) often have excessive permissions, creating dangerous edges in the attack graph. Use Microsoft Graph PowerShell to audit and remediate these risks.
Verified PowerShell Command: Audit Service Principals with High-Risk Permissions
 Connect to Microsoft Graph with required scopes
Connect-MgGraph -Scopes "Application.Read.All", "Directory.Read.All"

Get all service principals and their granted permissions
Get-MgServicePrincipal -All | Where-Object { $<em>.AppRoles -or $</em>.OAuth2PermissionGrants } | Select-Object DisplayName, AppId, ServicePrincipalType | Format-Table
Step-by-step guide:
- Install the Microsoft Graph PowerShell module:
Install-Module Microsoft.Graph. - Run `Connect-MgGraph` and consent to the required permissions.
- Executing the `Get-MgServicePrincipal` command lists all applications and service principals, filtering for those with granted permissions (
AppRolesorOAuth2PermissionGrants). - This list is the starting point for a manual review to remove unnecessary, high-privilege permissions (like
Directory.ReadWrite.All) that could be abused for lateral movement within Azure AD.
6. Mitigating Kerberoasting with Strong Service Principal Passwords
Kerberoasting is a classic attack that exploits weak encryption on service accounts. Attackers request Kerberos tickets for services and attempt to crack them offline. Mitigation involves using Managed Identities or setting strong, random passwords for service accounts.
Verified PowerShell Command: Set a Strong, Random Password for a Service Account
 Generate a 256-bit random password
$Password = -join ((33..126) | Get-Random -Count 64 | % {[bash]$_})
 Convert to Secure String
$SecurePassword = ConvertTo-SecureString -String $Password -AsPlainText -Force
 Set the account password (e.g., for a user account used as a service logon)
Set-ADAccountPassword -Identity "svc_sql" -NewPassword $SecurePassword -Reset
Step-by-step guide:
- This command is run from a machine with the Active Directory PowerShell module, by a user with permission to reset the target account’s password.
- The first line generates a 64-character random password from the printable ASCII character set.
- The password is converted to a secure string and then applied to the specified service account (
svc_sql). - A long, complex password makes the resulting Kerberos ticket extremely resistant to offline cracking, effectively mitigating the Kerberoasting attack technique.
-
Leveraging Azure Resource Graph for Cloud Infrastructure Visibility
Beyond identity, the cloud infrastructure itself forms a graph. Azure Resource Graph (ARG) allows you to instantly query your resource inventory across subscriptions, which is critical for identifying misconfigurations like publicly exposed storage accounts.
Verified KQL for Azure Resource Graph: Find Public Storage Accounts
resources
| where type =~ 'microsoft.storage/storageaccounts'
| where properties.allowBlobPublicAccess == true or isnull(properties.allowBlobPublicAccess)
| project subscriptionId, resourceGroup, name, location, publicAccess=properties.allowBlobPublicAccess
Step-by-step guide:
- In the Azure Portal, navigate to Azure Resource Graph Explorer.
- Paste the query into the query window and run it.
- The query lists all storage accounts where the `allowBlobPublicAccess` property is either set to `true` or is null (which historically defaulted to allowing public access).
- This provides a direct list of assets that need to be remediated to prevent data exfiltration, effectively querying the “cloud infrastructure graph” for a critical security weakness.
What Undercode Say:
- The Defender’s Asymmetry is Eroding. For years, defenders fought disconnected alerts while attackers operated on a holistic graph of relationships. Sentinel’s Graph is a critical step towards giving defenders the same contextual, interconnected view of their environment, turning a defensive disadvantage into a potential strength.
- Automation is Non-Negotiable. The scale of modern environments means manual investigation of graph-derived attack paths is impossible. The true value of this technology will only be realized when it is integrated with automated playbooks in Azure Logic Apps to automatically quarantine devices, revoke sessions, or disable high-risk user accounts upon the detection of a critical, verified attack path.
The introduction of graph capabilities into a mainstream SIEM like Sentinel is a validation of a decade of offensive security research from tools like BloodHound. It signals a maturation of the defensive mindset from simply detecting malicious events to understanding and disrupting malicious campaigns. However, the tool’s effectiveness is entirely dependent on the quality and breadth of data ingested. Organizations with poor logging coverage will have a fragmented, unreliable graph, creating a false sense of security. The focus must first be on deploying the necessary agents and connecting all critical data sources before the graph can paint a true picture of the threat landscape.
Prediction:
The integration of graph theory into core SIEM platforms will fundamentally alter the cat-and-mouse game of network security. We predict that within two years, graph-based attack path analysis will become a standard component of Security Operations Centers (SOCs), leading to a measurable decrease in the success rate of broad lateral movement attacks. This will force attackers to shift their focus towards more sophisticated, zero-day-based persistence mechanisms and software supply chain compromises to achieve their objectives, as the “low-hanging fruit” of misconfigured relationships and weak identity hygiene becomes harder to exploit.
🎯Let’s Practice For Free:
IT/Security Reporter URL:
Reported By: Derkvanderwoude %F0%9D%90%91%F0%9D%90%9E%F0%9D%90%9A%F0%9D%90%A5 – Hackers Feeds
Extra Hub: Undercode MoN
Basic Verification: Pass ✅


