
Listen to this Post
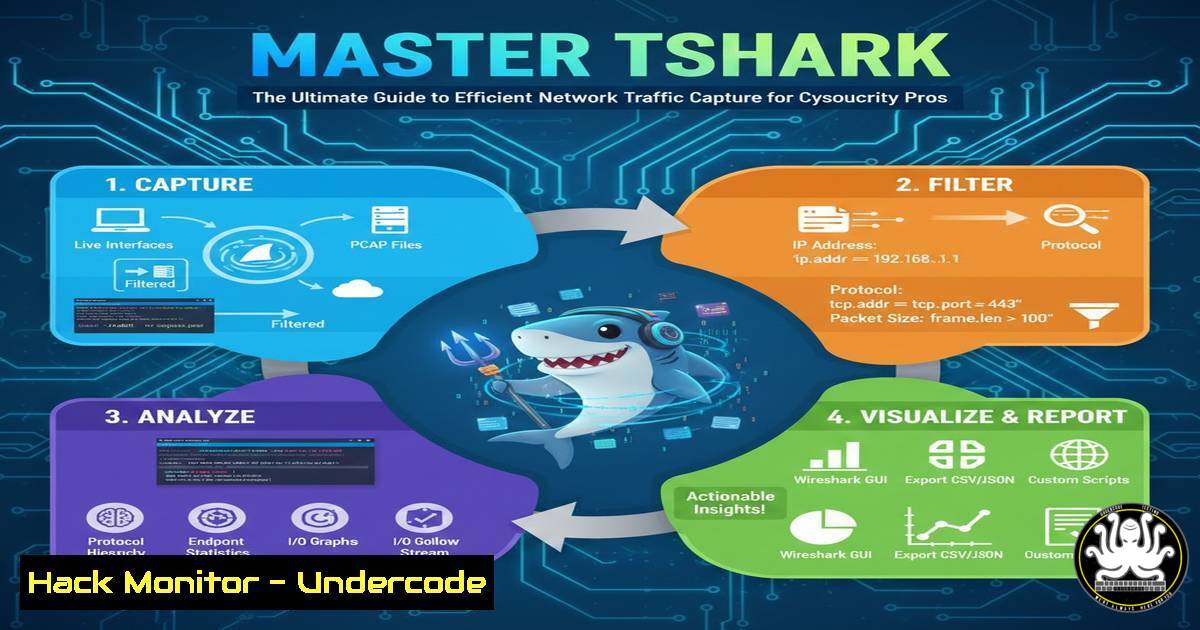
Introduction:
In the realm of network security analysis, efficient data collection is paramount. Tshark, the powerful command-line counterpart to Wireshark, empowers professionals to perform targeted packet captures, balancing the need for critical information with system resource constraints. This guide delves into the advanced techniques for optimizing your network investigations, moving beyond basic capture to forensically sound, storage-conscious data acquisition.
Learning Objectives:
- Master the use of Tshark’s `-c` and `-s` parameters for controlled packet capture.
- Understand how to combine multiple Tshark flags for complex, real-world investigations.
- Learn to transition seamlessly from command-line capture to graphical analysis in Wireshark.
You Should Know:
1. Controlling Packet Count with Tshark
In network forensics, capturing an uncontrolled stream of packets can lead to storage exhaustion and analysis paralysis. The `-c` (count) flag is your first line of defense, allowing you to set a hard limit on the number of packets captured. This is crucial for incident response where you need a quick, targeted snapshot of network activity.
Step‑by‑step guide explaining what this does and how to use it.
1. Identify your active network interface. Open a terminal and run `tshark -D` to list all available interfaces. Note the name of the interface you wish to monitor (e.g., eth0, ens33, or Wi-Fi).
2. Execute a limited packet capture. To capture exactly 5 packets from interface eth0, use the command: tshark -c 5 -i eth0.
3. Analyze the output. Tshark will print the summary of each captured packet to stdout and then terminate automatically after the 5th packet. This is ideal for quick connectivity tests or verifying that specific traffic is present on the wire.
2. Optimizing Storage with Snapshot Length
The `-s` (snapshot length) flag controls how much of each packet is captured. Often, for protocol analysis or tracking communication flows, the packet header (which contains source, destination, and port information) is sufficient. Capturing the entire payload (the `-s 0` option) is only necessary when you need to inspect the actual data being exchanged, such as in malware analysis or data exfiltration investigations.
Step‑by‑step guide explaining what this does and how to use it.
1. Capture only packet headers. To capture 5 packets, but limit each to the first 64 bytes (a common size sufficient for header information), use: tshark -c 5 -s 64 -i eth0.
2. Capture full packets for deep inspection. To capture 5 complete packets, including all payload data, use: tshark -c 5 -s 0 -i eth0.
3. Compare the outputs. Run both commands and observe the difference in the level of detail. The first command will be much faster and generate less data, highlighting the trade-off between depth and efficiency.
3. Combining Parameters for Forensic Capture
For a production-level investigation, you will combine multiple parameters into a single, powerful command. This ensures your evidence is collected in a consistent, reliable, and court-admissible manner. The `-w` (write) flag is critical here, as it saves the raw packet data to a file for later analysis, rather than just displaying it on the screen.
Step‑by‑step guide explaining what this does and how to use it.
1. Formulate the comprehensive command. A standard forensic capture command looks like this: tshark -c 500 -s 128 -i eth0 -w limited.pcap.
– -c 500: Stop after 500 packets.
– -s 128: Capture the first 128 bytes of each packet.
– -i eth0: Capture from the `eth0` interface.
– -w limited.pcap: Save the raw packets to a file named limited.pcap.
2. Generate traffic for testing. While the capture is running, generate some network traffic. A simple way is to ping a website: ping -c 4 google.com.
3. Verify the capture file. The command will exit after 500 packets. You can verify the file was created by running ls -la limited.pcap.
4. Advanced Interface Selection and Filtering
Professional analysts rarely capture all traffic. Using filters and selecting the correct interface is fundamental. Tshark allows you to apply Berkeley Packet Filter (BPF) syntax to capture only the traffic relevant to your investigation, such as traffic from a specific host or on a specific port.
Step‑by‑step guide explaining what this does and how to use it.
1. Capture HTTP traffic only. To capture only web traffic (port 80) on interface eth0, use: tshark -c 100 -i eth0 -w http_traffic.pcap port 80.
2. Capture traffic to/from a specific IP. To monitor all communication with a suspect IP, use: tshark -c 200 -i eth0 -w suspect_comm.pcap host 192.168.1.100.
3. Combine filters. You can combine conditions. For example, to capture non-HTTP traffic from a specific IP: tshark -i eth0 -w filtered.pcap host 192.168.1.100 and not port 80.
5. Leveraging Ring Buffers for Long-Term Monitoring
For continuous monitoring, capturing to a single file is impractical. The ring buffer option (-b) allows Tshark to create a series of files, switching to a new file once a condition (like file size or duration) is met, and overwriting the oldest file when a file limit is reached. This is essential for SOC and NOC environments.
Step‑by‑step guide explaining what this does and how to use it.
1. Create a ring buffer based on file count. The following command will capture data, creating a new file every 1 megabyte, and maintain a ring of 10 files. Once the 11th file is created, the 1st file is overwritten.
`tshark -i eth0 -w capture_ -b filesize:1000 -b files:10`
2. Use a time-based ring buffer. To create a new file every hour, maintaining 24 files (one per hour), you could use: tshark -i eth0 -w hourly_capture_ -b duration:3600 -b files:24.
6. Transitioning to Graphical Analysis with Wireshark
The ultimate workflow involves using Tshark for efficient, scriptable, and remote capture, and then using Wireshark for deep, graphical analysis. The PCAP file generated by Tshark is natively readable by Wireshark.
Step‑by‑step guide explaining what this does and how to use it.
1. Launch Wireshark with your capture file. From the terminal, you can open your saved `limited.pcap` file directly into Wireshark: wireshark limited.pcap &. The `&` runs the command in the background, freeing up your terminal.
2. Perform advanced analysis. Within Wireshark, you can use powerful features like Follow TCP Stream, I/O Graphs, and Expert Info to uncover patterns, extract files, and identify anomalies that are difficult to spot in the command line.
3. Correlate evidence. Use the statistical tools in Wireshark to validate the findings from your targeted Tshark capture, creating a comprehensive view of the network event.
What Undercode Say:
- Precision Over Volume: The modern security analyst’s mantra is shifting from “capture everything” to “capture what matters.” Mastery of Tshark’s filtering and limiting flags is no longer a niche skill but a core competency for effective incident response and threat hunting.
- The Scriptable Sensor: Tshark’s command-line nature makes it the ideal tool for automation. It can be integrated into security orchestration scripts, deployed on remote sensors, and used to capture data based on triggers from other security systems, creating a dynamic and responsive security monitoring infrastructure.
The ability to surgically extract specific network data is what separates junior technicians from senior analysts. In an era of multi-gigabit networks and sprawling cloud environments, brute-force packet capture is not just impractical—it’s a liability. The techniques outlined here form the foundation of a scalable network security monitoring strategy. By controlling the volume and scope of captured data, organizations can significantly reduce storage costs, accelerate analysis times, and improve the signal-to-noise ratio in their investigations, ultimately leading to faster detection and mitigation of security threats.
Prediction:
The evolution of network threats, particularly the encryption of malicious traffic and the use of low-and-slow data exfiltration techniques, will make targeted capture and metadata analysis even more critical. The future of network forensics lies in AI-driven pre-capture filtering, where Tshark and similar tools will be guided by machine learning models to capture only anomalous or high-risk sessions in real-time. Furthermore, as edge computing and IoT explode, the lightweight, scriptable nature of Tshark will make it the de facto tool for security monitoring on resource-constrained devices, pushing advanced traffic analysis capabilities to the very perimeter of the network.
🎯Let’s Practice For Free:
IT/Security Reporter URL:
Reported By: Vernon H – Hackers Feeds
Extra Hub: Undercode MoN
Basic Verification: Pass ✅


