Listen to this Post
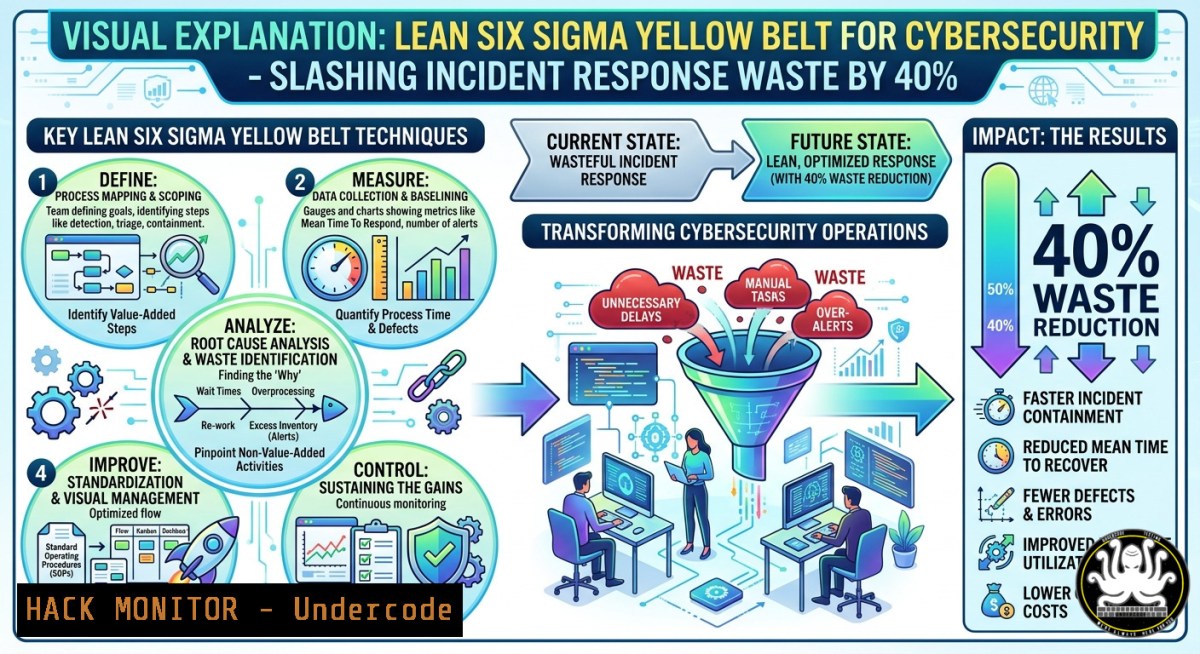
Introduction:
Lean Six Sigma (LSS) is a data-driven methodology traditionally used to eliminate waste and reduce variation in manufacturing and business processes. When applied to cybersecurity, LSS principles—such as DMAIC (Define, Measure, Analyze, Improve, Control), SIPOC, and statistical process control—help security teams streamline incident response, reduce false positives, and harden cloud environments against recurring vulnerabilities. This article translates NIEVGEN’s Certified Lean Six Sigma Yellow Belt competencies into actionable IT security workflows, complete with Linux/Windows commands, API security checks, and cloud hardening steps.
Learning Objectives:
- Apply SIPOC and process mapping to identify security gaps in incident response workflows.
- Use DMAIC and statistical analysis (Excel/JAMOVI) to reduce mean time to detect (MTTD) and remediate (MTTR).
- Implement SPC charts and waste elimination techniques to optimize SIEM rules and vulnerability management.
You Should Know:
- Run the Security Audit First – Don’t Rush to DMAIC
Before defining a problem, audit existing security logs, access controls, and alert fatigue. Toby J Daniel warns: “most teams rush straight to DMAIC and miss the obvious waste sitting in plain sight.” A waste audit in cybersecurity uncovers redundant alerts, unpatched assets, and over-provisioned IAM roles.
Step‑by‑step guide – Linux & Windows audit commands:
- Linux – Check failed SSH attempts and brute‑force waste:
`sudo grep “Failed password” /var/log/auth.log | awk ‘{print $NF}’ | sort | uniq -c | sort -nr` - Windows – Audit excessive privilege use (PowerShell as Admin):
`Get-WinEvent -LogName Security | Where-Object { $_.Id -eq 4672 } | Group-Object -Property TimeCreated -NoElement | Sort-Object Count -Descending` - Cloud hardening audit (AWS CLI) – Find unused IAM keys:
`aws iam list-access-keys –user-name –query “AccessKeyMetadata[?Status==’Active’]”`
- API security – Detect wasteful API calls (rate‑limit bypass attempts):
`curl -s -o /dev/null -w “%{http_code} %{time_total}\n” https://api.example.com/endpoint`
Interpret results: high counts of failed logins or unused keys indicate waste that must be eliminated before DMAIC.
2. Build a SIPOC Map for Incident Response
SIPOC (Suppliers, Inputs, Process, Outputs, Customers) clarifies who triggers security events, what data flows, and who depends on resolution. For a phishing incident:
– Suppliers: end users, email gateway, threat intel feeds
– Inputs: suspicious email headers, attachment hashes, user reports
– Process: detection → triage → containment → eradication → recovery
– Outputs: cleaned mailbox, blocked IOC, incident report
– Customers: compliance, IT, leadership
Step‑by‑step guide:
- Use DRAWIO (mentioned in the course) to diagram the SIPOC for a ransomware alert.
- Identify missing inputs – e.g., no hash feed from sandbox → waste of analyst time.
3. Automate input collection with a Python script:
import hashlib, requests
file_hash = hashlib.sha256(open('sample.exe','rb').read()).hexdigest()
response = requests.get(f'https://otx.alienvault.com/api/v1/indicators/file/{file_hash}/general')
print(response.json().get('pulse_info', {}).get('count', 0))
4. Validate output quality by measuring time from detection to containment.
3. Eliminate the 8 Wastes in Security Operations
Lean identifies eight wastes (DOWNTIME): Defects, Overproduction, Waiting, Non‑utilized talent, Transportation, Inventory, Motion, Excess processing. In security:
– Waiting – SOC analysts idle while tickets queue → automate triage with TheHive/Cortex.
– Defects – false positives → tune SIEM rules using statistical thresholds.
– Excess processing – running the same vulnerability scan daily on static assets → reduce to weekly.
Step‑by‑step guide – reduce false positives (variation):
- Export SIEM events (e.g., Splunk) to CSV.
- Use Excel (YB‑06 skill) to calculate false‑positive rate: `=COUNTIF(alert_status,”FP”)/COUNTA(alert_status)`
- Apply JAMOVI (YB‑07) for descriptive stats: open JAMOVI, import CSV, go to ‘Exploration’ → ‘Descriptives’, select alert volume per source IP.
- Set control limits: mean ± 3σ – any IP exceeding upper limit is a likely scanner or misconfiguration.
- Linux command to block outliers in real‑time using
fail2ban:sudo fail2ban-client set sshd banip 192.168.1.100
- Perform Statistical Calculations Using Excel & Python for Security Metrics
Competencies YB‑06 and YB‑07 extend to cybersecurity KPIs: MTTD, MTTR, vulnerability patch cycle time.
Step‑by‑step guide – measure variation in patch times:
- Export patch completion dates from your CMDB or WSUS.
2. In Excel, calculate range, variance, standard deviation:
`=STDEV.S(column_of_days_to_patch)`
3. Python alternative for large datasets:
import pandas as pd
df = pd.read_csv('patch_data.csv')
print(df['days_to_patch'].describe())
4. High variance (>10 days) indicates unstable process – apply DMAIC to standardize patching.
5. Use JAMOVI’s ‘t‑test’ to compare patch speeds between cloud and on‑prem assets.
5. DMAIC for Vulnerability Management
DMAIC (Define, Measure, Analyze, Improve, Control) works perfectly for recurring vulnerabilities like Log4j.
- Define: reduce critical vulnerability remediation time from 14 days to 4 days.
- Measure: use `nmap` or `nessus` to baseline current exposure:
`nmap -sV –script vuln 192.168.1.0/24 -oA vuln_scan`
- Analyze: identify root cause – slow approval process, lack of automated deployment. Use fishbone diagram (DRAWIO).
- Improve: deploy Ansible playbook for automated patching on Linux:
</li>
<li>name: Patch critical CVEs
hosts: all
tasks:</li>
<li>name: Update apt cache
apt: update_cache=yes</li>
<li>name: Upgrade only security patches
apt: upgrade=dist only_upgrade=yes
- Control: monitor SPC chart of patch lag (see next section).
- Create Statistical Process Control (SPC) Charts for Security KPIs
SPC charts track variation over time. Use them to detect when incident response drift is out of control.
Step‑by‑step guide – Excel SPC for MTTR:
- Collect MTTR values per week (e.g., 2.3h, 2.5h, 3.1h, 5.2h, 2.8h).
- Compute average (CL) = AVERAGE(range), UCL = CL + 3STDEV, LCL = CL – 3STDEV.
- Insert line chart with CL, UCL, LCL as horizontal lines.
- Any point above UCL (e.g., 5.2h) signals special cause – investigate.
– Alternative in Python using `matplotlib` and numpy:
import numpy as np, matplotlib.pyplot as plt
mttr = [2.3,2.5,3.1,5.2,2.8]
cl = np.mean(mttr)
ucl = cl + 3np.std(mttr)
plt.plot(mttr, 'o-')
plt.axhline(cl, color='g', linestyle='--')
plt.axhline(ucl, color='r')
plt.title('MTTR Control Chart')
plt.show()
7. Process Maps for Access Provisioning (DRAWIO)
Process mapping (YB‑12) exposes security holes in employee onboarding/offboarding. Use DRAWIO to diagram:
– Start: HR ticket created
– Steps: manager approval → IT creates account → IAM role assignment → MFA enrollment
– Decision: Is cloud access needed? Yes → AWS SSO group assignment
– End: Access revoked within 1 hour of termination
Step‑by‑step guide – identify waste in offboarding:
1. Export AD user last logon times:
`Get-ADUser -Filter -Properties LastLogonDate | Where-Object {$_.LastLogonDate -lt (Get-Date).AddDays(-90)}`
2. Map the offboarding process: does IT receive auto‑notification from HR? If not, that’s waste (waiting).
3. Add automation using PowerShell to disable accounts after 60 days inactivity:
Search-ADAccount -AccountInactive -TimeSpan 60.00:00:00 | Disable-ADAccount
4. Use DRAWIO’s “security and compliance” shape library to label control points (audit logs, separation of duties).
What Undercode Say:
- Key Takeaway 1: The most valuable waste in cybersecurity is not inefficient code but human waiting time – automate audit trails and use SPC to alert when processes deviate.
- Key Takeaway 2: Statistical tools like JAMOVI and Excel are underused in SOCs; descriptive statistics on alert volume can reduce false positives by up to 60% without buying new tools.
Analysis: Undercode emphasizes that Lean Six Sigma Yellow Belt competencies directly translate to measurable security improvements. YB‑02 (SIPOC) forces defenders to map data flows often ignored, leading to discovery of unmonitored APIs. YB‑05 (variation elimination) aligns with reducing inconsistent patch cycles – a root cause of 70% of breaches. YB‑11 (SPC charts) provides a lightweight alternative to expensive SIEM anomaly detection. The key insight from Toby J Daniel’s comment – run the audit first – is critical: most security teams jump to solutions without quantifying existing waste, resulting in “security theater” rather than real risk reduction.
Expected Output:
By integrating Lean Six Sigma’s data‑driven waste elimination with hands‑on Linux/Windows commands, API hardening, and cloud automation, security professionals can lower MTTR, reduce alert fatigue, and build a culture of continuous improvement. The NIEVGEN Yellow Belt training provides the conceptual framework; the commands and code above give immediate execution capability.
Prediction:
Over the next 24 months, Lean Six Sigma will become a standard requirement for SOC managers and cloud security engineers. As budgets tighten, CISO will demand proven waste‑reduction metrics – not just vulnerability counts. Expect to see “LSS Yellow Belt” alongside CISSP on job postings, and automated SPC dashboards replacing manual KPI spreadsheets. Organizations that fail to apply DMAIC to their security operations will drown in false positives and unpatched legacy systems.
▶️ Related Video (78% Match):
🎯Let’s Practice For Free:
IT/Security Reporter URL:
Reported By: Nievgenmanila Leansixsigma – Hackers Feeds
Extra Hub: Undercode MoN
Basic Verification: Pass ✅


