Listen to this Post
Introduction:
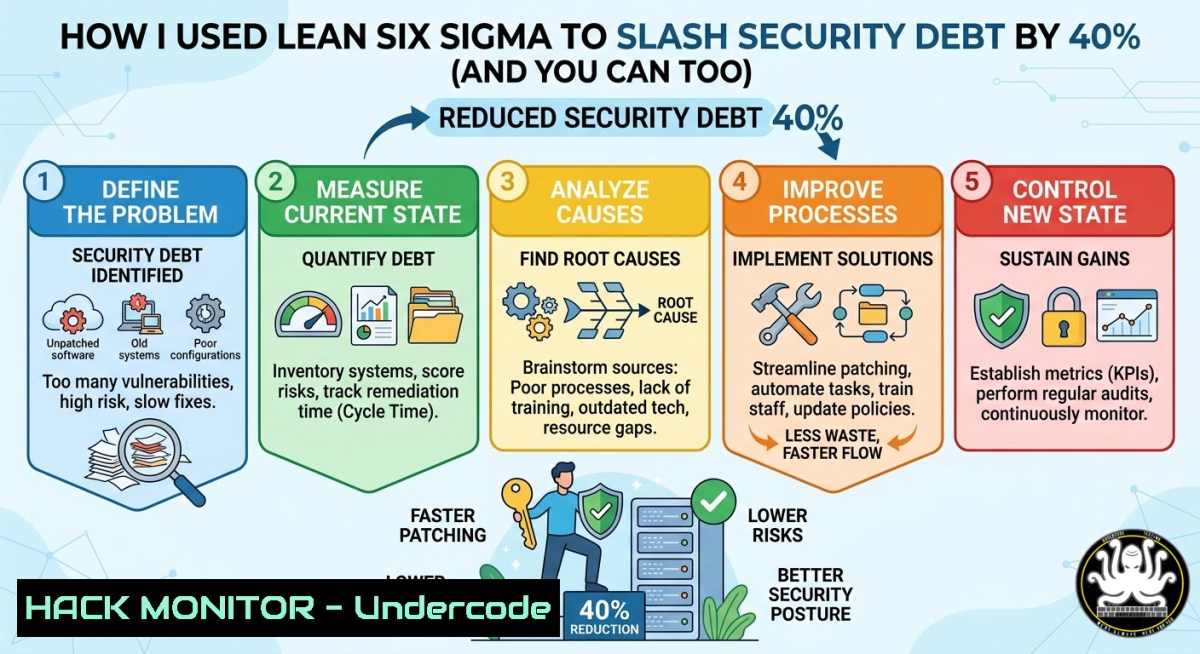
Lean Six Sigma (LSS) isn’t just for manufacturing – it’s a data‑driven framework that systematically eliminates waste (non‑value‑added activities) and reduces variation in any process, including cybersecurity operations. When applied to IT and AI workflows, LSS tools like DMAIC (Define, Measure, Analyze, Improve, Control) and Statistical Process Control (SPC) help security teams identify root causes of recurring incidents, optimize threat detection pipelines, and harden cloud configurations with measurable outcomes.
Learning Objectives:
- Apply DMAIC methodology to reduce false positives in SIEM alerts and streamline incident response playbooks.
- Use statistical analysis (Excel, JAMOVI, Python) to detect anomalies in system logs and API call patterns.
- Create process maps with DRAWIO to visualize access control workflows and identify single points of failure.
You Should Know:
- Using SIPOC + Process Maps to Map Your Attack Surface
A SIPOC (Suppliers, Inputs, Process, Outputs, Customers) diagram is your first line of defense against scope creep in security projects. Before you tune any firewall or patch a server, map exactly how data flows through your environment. Start with a high‑level process map using DRAWIO (free, browser‑based diagramming tool).
Step‑by‑step guide for creating a security process map:
- Identify the core process: e.g., “User authentication to internal dashboard”.
- List Suppliers: Identity Provider (Azure AD / Okta), network firewall, user’s device.
- Define Inputs: Username/password, MFA token, device posture JSON, API key.
- Map the Process Steps (using DRAWIO shapes): Request → TLS handshake → Auth request to IdP → Policy evaluation → Allow/Deny.
- Specify Outputs: Session token (JWT), audit log entry, access decision.
- Identify Customers: Security audit team, SOC analyst, compliance officer.
Linux/Windows command to visualize current authentication flows:
 Linux - follow real-time auth logs to see 'waste' (repeated failed attempts)
sudo journalctl -u sshd -f | grep "Failed password"
 Windows PowerShell - monitor failed logon events (Event ID 4625)
Get-WinEvent -FilterHashtable @{LogName='Security'; ID=4625} -MaxEvents 50 | Format-List TimeCreated, Message
Then overlay these logs onto your DRAWIO map. Where are the delays? Where do failures cluster? That’s your “waste” – reducing it decreases incident response time (MTTR).
- Eliminating Variation in SIEM Queries with SPC Charts
Security events are rarely stable; log volumes spike during scans or attacks. Statistical Process Control (SPC) charts help you distinguish normal “common cause” variation from “special cause” variation (e.g., a data exfiltration attempt). You can build these charts using Excel, JAMOVI (free open‑source stats tool), or Python.
Step‑by‑step to build a U‑chart (for count of security events per hour):
– Collect hourly event counts from your SIEM (Splunk, ELK) into a CSV.
– Open JAMOVI → Import data → Select ‘Variable’ as ‘event_count’.
– Click ‘Quality Control’ → ‘Attribute Control Charts’ → Choose ‘U‑chart’.
– Input ‘event_count’ as ‘Counts’ and define subgroup size (e.g., 1 hour).
– Identify points outside the upper control limit (UCL). Those hours require root‑cause analysis.
If you prefer Excel:
- Calculate average (U-bar) = AVERAGE(event_range).
- Compute standard deviation of counts.
- UCL = U-bar + 3σ, LCL = max(0, U-bar – 3σ).
- Use conditional formatting to highlight outliers.
For automation, use a Python script:
import pandas as pd
import numpy as np
df = pd.read_csv('security_events.csv')
hourly_counts = df.groupby(pd.to_datetime(df['timestamp']).dt.hour).size()
avg = hourly_counts.mean()
ucl = avg + 3  hourly_counts.std()
print(f"UCL: {ucl} – investigate hours where count > {ucl}")
When you find a special cause (e.g., a misconfigured cron job flooding logs), you’ve eliminated variation and reduced noise for your SOC.
3. DMAIC for Hardening Cloud IAM Policies
Waste in cloud security often appears as over‑permissive IAM roles (principle of least privilege violation). Apply DMAIC:
– Define: Reduce excess permissions by 50% across three AWS accounts.
– Measure: Run IAM Access Analyzer or `aws iam list‑policies` to baseline number of policies with ‘Action: “”’.
– Analyze: Use Excel pivot tables to group policies by service (S3, EC2). Which service has the most wildcards?
– Improve: Write a remediation script (PowerShell or AWS CLI) to generate least‑privilege policies.
– Control: Set up AWS Config rule `iam‑policy‑no‑statements‑with‑full‑access` and enable auto‑remediation.
Step‑by‑step improvement commands (Linux/macOS terminal):
 List all customer managed policies with full access
aws iam list-policies --scope Local --query 'Policies[?DefaultVersionId!=<code>null</code>].[PolicyName,Arn]' --output text | while read name arn; do
aws iam get-policy-version --policy-arn $arn --version-id $(aws iam get-policy --policy-arn $arn --query 'Policy.DefaultVersionId' --output text) --query 'PolicyVersion.Document.Statement[?Action==``]' --output text && echo "$name has full access"
done
Then apply the improved policy using a generated least‑privilege JSON template. This directly reduces your attack surface – a tangible security win.
- Statistical Analysis of Phishing Simulation Data Using JAMOVI
Most phishing campaigns produce raw click‑rates but no root‑cause analysis. Use descriptive statistics and correlation tests to understand why users click. JAMOVI makes this accessible without coding.
Step‑by‑step:
- Export simulation results: columns for ‘department’, ‘link_clicked’ (0/1), ‘time_on_email’ (seconds), ‘previous_training’ (Yes/No).
- Open JAMOVI → ‘Analyses’ → ‘Frequencies’ → ‘Contingency Tables’ → test association between ‘department’ and ‘click’.
- Then use ‘Independent Samples T‑Test’ to compare ‘time_on_email’ between clicked and non‑clicked groups.
- Visualize with ‘Descriptives’ → ‘Box plots’ to spot outliers (e.g., one user taking 5 minutes on a fake invoice).
Result: If your analysis shows ‘previous_training’ has no statistical effect, your training content is waste. Redesign using lean principles – focus on specific scenarios (e.g., CEO fraud) rather than generic videos.
Windows PowerShell command to pull phishing click rates from Microsoft 365:
Connect-ExchangeOnline
Get-AuditLog -OperationType "ClickOnThreat" -StartDate (Get-Date).AddDays(-30) | Group-Object -Property UserId | Select Name, Count
Combine that JAMOVI output into a DMAIC control plan: monthly SPC chart of click rate by department.
- Automating Waste Detection in Linux Logs with Jamovi + CLI
Waste (Muda) in security includes repetitive manual log reviews. We can statistically identify which log sources produce the most false positives and automate their tuning.
Step‑by‑step script (Linux):
- Collect all alerts from your IDS/IPS (e.g., Suricata) into `alerts.csv` with columns: timestamp, signature, src_ip, dst_ip.
- Count frequency of each signature using
sort | uniq -c. - In JAMOVI, perform Pareto analysis: ‘Quality Control’ → ‘Pareto Chart’. Input counts. The top 20% of signatures cause 80% of analyst time – those are your waste.
- Write a cron job to re‑run analysis weekly. When a signature’s count exceeds 3 sigma for three weeks, automatically disable it in Snort/Suricata (but only after writing a case paper – YB‑09 style).
Example automation script:
!/bin/bash
 Extract and count Suricata alerts
grep "CLASSIFICATION" /var/log/suricata/fast.log | cut -d' ' -f5 | sort | uniq -c | sort -nr > /tmp/top_alerts.txt
 Use Python to check 3‑sigma deviation from historical baseline
python3 << EOF
import pandas as pd
import sys
hist = pd.read_csv('/opt/security/baseline_counts.csv')
today = pd.read_csv('/tmp/top_alerts.txt', header=None, names=['count','sig'])
for idx, row in today.iterrows():
sig = row['sig']
mean = hist[hist['signature']==sig]['count'].mean()
std = hist[hist['signature']==sig]['count'].std()
if row['count'] > mean + 3std:
print(f"WARNING: {sig} exceeds UCL – investigate or auto‑tune")
EOF
This merges Lean Six Sigma’s data‑driven elimination of variation with real‑time security operations.
What Undercode Say:
- Key Takeaway 1: Lean Six Sigma yellow belt is not a trophy – the case papers (YB‑09, YB‑10) force you to apply DMAIC to your own work, turning abstract statistical concepts into actionable security improvements.
- Key Takeaway 2: You don’t need expensive tools – Excel, JAMOVI (free), DRAWIO (free), and built‑in OS commands give you everything to start measuring, analyzing, and controlling vulnerabilities in cloud, API, and log pipelines.
Analysis: Most security teams rush to deploy “AI‑powered” detection without first stabilizing their processes. Lean Six Sigma provides the missing statistical discipline. For example, without SPC, a sudden spike in firewall denies could be ignored as “noise” – but with 3‑sigma limits, you instantly flag it as a potential breach. The same applies to AI model drift: treat model accuracy as a process parameter, build control charts on F1‑score, and investigate when it falls below the lower control limit. This is how you move from reactive firefighting to predictive, data‑driven security governance.
Prediction:
Within two years, mature SOCs will embed Lean Six Sigma green belts as standard roles, using AI‑assisted statistical process control to auto‑tune detection rules. The line between “DevOps” and “Process Excellence” will blur – certification courses that teach data analysis (JAMOVI, Python, Excel) combined with security domain knowledge will become the new baseline for hiring. NIEVGEN’s focus on writing real case papers (not just multiple‑choice) positions its yellow belt as a practical, resume‑ready differentiator for IT and cybersecurity professionals.
▶️ Related Video (76% Match):
🎯Let’s Practice For Free:
IT/Security Reporter URL:
Reported By: Nievgen John – Hackers Feeds
Extra Hub: Undercode MoN
Basic Verification: Pass ✅


