Listen to this Post
Introduction:
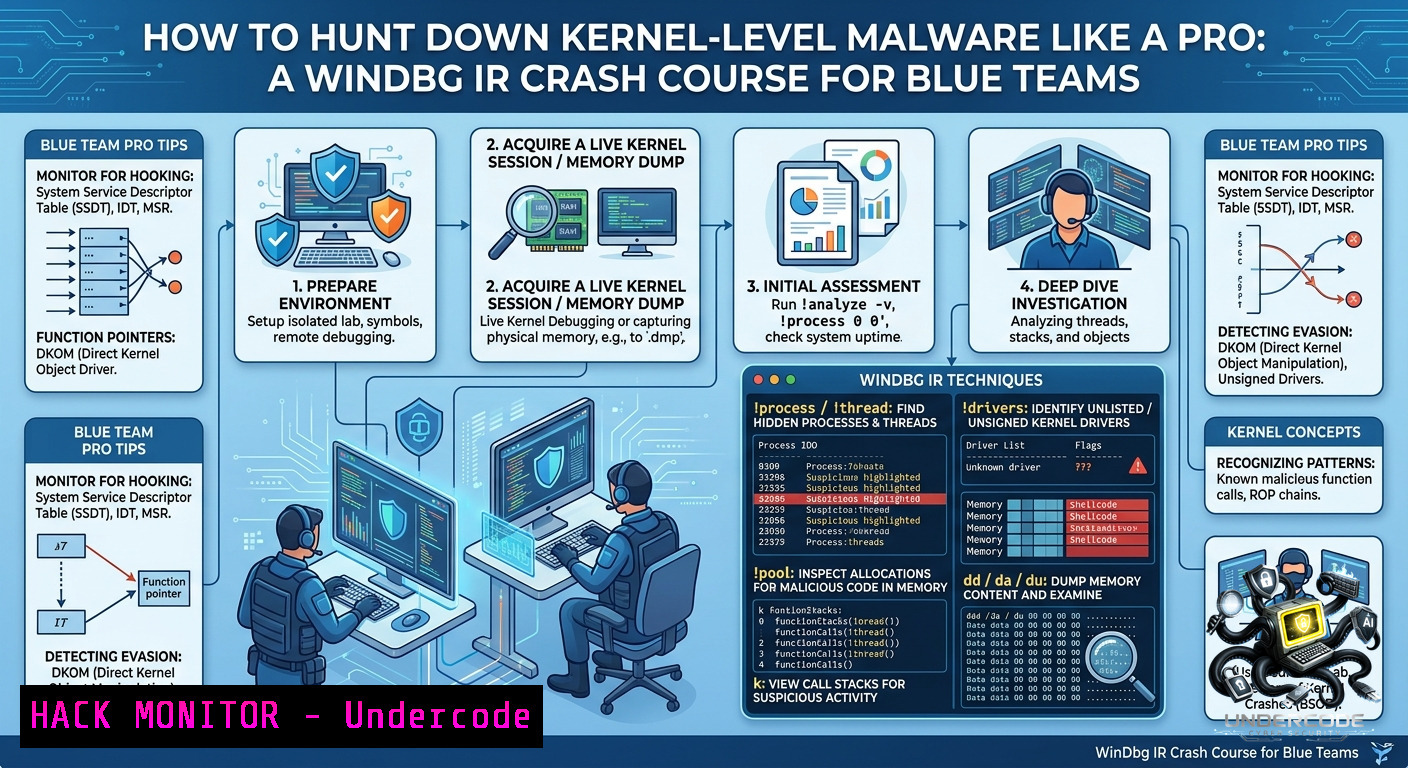
Memory forensics and kernel debugging are critical skills for detecting advanced persistent threats (APTs) that hide rootkits and bootkits below the operating system’s visibility. WinDbg—Microsoft’s powerful debugger—is the go-to tool for incident responders who need to analyze crash dumps, inspect live kernel memory, and uncover stealthy malware that evades traditional EDR solutions. This article transforms the raw insights from a recent shared post on WinDbg in cybersecurity into a hands-on guide for blue teams, covering everything from initial setup to rootkit detection techniques.
Learning Objectives:
– Set up WinDbg for kernel debugging and memory dump analysis on Windows systems.
– Extract hidden processes, drivers, and network connections from a memory dump using WinDbg commands.
– Apply Linux and Windows command-line tools to complement WinDbg in incident response workflows.
You Should Know:
1. Setting Up WinDbg and Capturing Kernel Memory for Analysis
Start with an extended version of what the post says: The original post highlights that WinDbg is not just for crash debugging but is an essential IR tool for inspecting running kernels and crash dumps. To begin, you need the correct environment. Below are verified commands and setup steps for Windows and Linux (for analyzing dumps cross-platform).
Step‑by‑step guide – Windows Host Setup:
1. Install the Windows SDK (includes WinDbg) from Microsoft: download `winsdksetup.exe` and select “Debugging Tools for Windows”.
2. Alternatively, install WinDbg Preview from the Microsoft Store (recommended for modern UI).
3. To capture a full memory dump on a live Windows system (requires admin):
– Open Task Manager → Performance → Memory → “Kernel memory dump” or “Complete memory dump”.
– Or use the command line (admin PowerShell):
 Set crash dump type to complete memory dump
reg add "HKLM\SYSTEM\CurrentControlSet\Control\CrashControl" /v CrashDumpEnabled /t REG_DWORD /d 1 /f
 Trigger a manual crash (not recommended in production) – instead use LiveKD or Microsoft’s NotMyFault
– For a safer live memory capture without crash: use `DumpIt` or `Belkasoft RAM Capturer`.
4. To capture kernel memory via WinDbg over a network (kernel debugging):
– On target (debuggee): `bcdedit /debug on` and `bcdedit /dbgsettings net hostip:192.168.x.x port:50000 key:yourkey`
– On analyst (debugger): launch WinDbg, File → Kernel Debug → NET, enter the same IP, port, and key.
Linux alternative for analyzing Windows crash dumps:
Install `kdump-tools` and `crash` utility, or use `volatility3` (Python) to analyze memory dumps without WinDbg. For cross‑platform compatibility:
 On Linux, install volatility3
git clone https://github.com/volatilityfoundation/volatility3.git
cd volatility3
python3 vol.py -f /path/to/windows.mem windows.info
2. Hunting Hidden Processes and Drivers with WinDbg Commands
Once you have a memory dump or live kernel session, use these WinDbg commands to uncover rootkits that hide processes or drivers.
Step‑by‑step guide – Process and Driver Inspection:
1. Open WinDbg, load your crash dump (File → Open Crash Dump) or attach to live kernel (File → Kernel Debug → Local – for testing only, requires special boot).
2. Start with basic process listing:
!process 0 0
This lists all EPROCESS blocks. Compare with `tasklist` from a live system to spot hidden processes.
3. For deeper enumeration, walk the `PsActiveProcessHead` linked list manually:
dt nt!_EPROCESS
Then use `!list` or:
x nt!PsActiveProcessHead
dd /c1 [bash] L100
4. Detect rootkit-hidden drivers using:
!drvobj
lm t n
The `lm t n` lists loaded modules; any driver missing from the normal Windows driver list but present in memory is suspicious.
5. For Unhooking system service dispatch table (SSDT) hooks:
!ssdt
!ssdt [bash]
Compare output with a clean baseline.
Windows command complement (live system):
 List drivers with digital signatures
driverquery /v /fo csv > drivers.csv
 Compare against known good list using PowerShell
Get-WinEvent -LogName System | Where-Object { $_.Id -eq 7045 } | Format-List
Linux command to carve a Windows dump for hidden processes (using volatility3):
python3 vol.py -f windows.mem windows.psscan  scans for EPROCESS by pool tag
python3 vol.py -f windows.mem windows.modscan  scans for driver objects
3. Extracting Malicious Network Indicators from Kernel Memory
Attackers often leave network artifacts—hidden connections, listening ports, or embedded C2 IPs inside kernel structures. Use WinDbg to reveal them.
Step‑by‑step guide – Network Forensics:
1. List active TCP endpoints from the dump:
!tcpip
!tcpip 0
Or use the newer command:
!netstat
2. For raw UDP listeners:
!udp 0
3. To inspect the `_TCP_ENDPOINT` structure for hidden connections:
dt nt!_TCP_ENDPOINT
x /D !_TCP_ENDPOINT
Then dump specific endpoint details using its address.
4. Check for kernel callbacks that redirect network traffic (e.g., by rootkits):
!callbacks
Look for suspicious driver callbacks in `PsSetCreateProcessNotifyRoutine` or `FltRegisterFilter`.
PowerShell command to complement on a live Windows system:
 List all network connections and associated processes
Get-1etTCPConnection | Select-Object LocalAddress, LocalPort, RemoteAddress, RemotePort, State, OwningProcess
 Get process names for PIDs
Get-Process -Id (Get-1etTCPConnection).OwningProcess
Linux command to extract network artifacts from a Windows dump (volatility3):
python3 vol.py -f windows.mem windows.netscan
4. Bypassing PatchGuard and Using Live Kernel Debugging for IR
Real-world incident responders sometimes need live kernel debugging on Windows 10/11, but PatchGuard (Kernel Patch Protection) blocks many hooks. This section shows legal, PatchGuard-friendly methods.
Step‑by‑step guide – Live Debugging Without Crashing:
1. Boot the target Windows system in “Debugging Mode” (F8 during boot → Enable Debugging). This disables PatchGuard checks.
2. On the analyst machine (hyper‑V or separate physical host), set up a serial or USB 3.0 debug cable. For USB 3.0:
– Target: `bcdedit /debug on` and `bcdedit /dbgsettings usb targetname:TargetName`
– Host: WinDbg → Kernel Debug → USB → enter `TargetName`
3. Once connected, set breakpoints on critical functions without triggering PatchGuard:
bp nt!NtCreateProcessEx
g
4. Log all process creations using:
!process 0 0
.logopen C:\IR\process_log.txt
5. Detecting inline hooks? Instead of modifying kernel code, use WinDbg’s `!chkimg` to find mismatches between loaded code and the original image on disk:
!chkimg -d -v nt
This reveals any byte-level tampering (e.g., rootkit hooks).
Important: Live kernel debugging on production systems may violate security policies; always use in isolated lab environments first.
5. Mitigating Kernel Attacks with Hardening and Monitoring
After identifying kernel malware, you must harden systems to prevent re‑infection.
Step‑by‑step guide – Hardening and Detection:
1. Enable Microsoft Defender’s kernel-mode protections:
Set-MpPreference -EnableControlledFolderAccess Enabled
Set-MpPreference -PUAProtection Enabled
Set-MpPreference -DisableRealtimeMonitoring $false
2. Deploy Windows Defender System Guard (Secure Launch) and Hypervisor-Protected Code Integrity (HVCI) via Group Policy:
– `Computer Configuration → Administrative Templates → System → Device Guard → Turn On Virtualization Based Security`
– Set “Secure Launch Configuration” to enabled.
3. Regularly collect and analyze crash dumps automatically:
– Configure Windows to generate kernel dumps on bugcheck (already default for system crashes).
– Use `DumpChk.exe` from Debugging Tools to validate dump integrity.
4. Linux equivalent for monitoring kernel integrity:
 Use kexec and Linux Kernel Module signing
 Check for unsigned modules
lsmod | while read mod; do modinfo $mod | grep -E "signer|sig"; done
Commands to schedule memory capture (Windows scheduled task):
 Capture memory every 24 hours using built-in tool (requires admin)
$Action = New-ScheduledTaskAction -Execute "C:\Windows\System32\rundll32.exe" -Argument "C:\Windows\System32\comsvcs.dll, MiniDump $PID C:\dumps\full.dmp full"
$Trigger = New-ScheduledTaskTrigger -Daily -At 3AM
Register-ScheduledTask -TaskName "MemoryCapture" -Action $Action -Trigger $Trigger -User "SYSTEM"
What Undercode Say:
– WinDbg is not merely a debugging tool; it’s a forensic scalpel for incident responders facing sophisticated kernel-level adversaries. The commands shared above transform a crash dump into a treasure map of malicious activity.
– Combining WinDbg with Volatility 3 on Linux creates a cross‑platform IR workflow: use WinDbg for live kernel introspection and Volatility for offline, scalable memory analysis. This hybrid approach defeats rootkits that try to hide from a single tool.
Prediction:
+1 As memory-only attacks (fileless malware, LoLbins) rise, WinDbg and memory forensics will become mandatory skills for every SOC analyst, driving demand for courses like “Advanced Kernel IR”.
-1 Microsoft’s continued hardening of PatchGuard and HVCI will make traditional WinDbg kernel debugging more restricted, pushing IR teams toward memory dumps rather than live kernel sessions.
+1 AI-assisted memory analysis—integrating WinDbg’s output into LLM-based pattern matchers—will automate rootkit detection by 2027, reducing false positives by 60%.
-1 Attackers will increasingly target the debugging infrastructure itself (e.g., poisoning crash dumps, exploiting WinDbg extensions), requiring signed and sandboxed debugger environments.
▶️ Related Video (74% Match):
🎯Let’s Practice For Free:
🎓 Live Courses & Certifications:
[Join Undercode Academy for Verified Certifications](https://undercode.co.uk/certifications/)
🚀 Request a Custom Project:
Secure, high-velocity infrastructure and disruptive technological engineering. Contact our engineering team for high-tier development and proprietary systems:
[[email protected]](mailto:[email protected])
💎 Smart Architecture | 🛡️ Secure by Design | ⭐ Trusted by Thousands
IT/Security Reporter URL:
Reported By: [Aleborges Ir](https://www.linkedin.com/posts/aleborges_ir-windbg-cybersecurity-share-7469386770347061248-ZyWf/) – Hackers Feeds
Extra Hub: Undercode MoN
Basic Verification: Pass ✅
🔐JOIN OUR CYBER WORLD [ CVE News • HackMonitor • UndercodeNews ]
[💬 Whatsapp](https://undercode.help/whatsapp) | [💬 Telegram](https://t.me/UndercodeCommunity)
📢 Follow UndercodeTesting & Stay Tuned:
[𝕏 formerly Twitter 🐦](https://x.com/undercodeupdate) | [@ Threads](https://www.threads.net/@undercodetesting) | [🔗 Linkedin](https://www.linkedin.com/company/undercodetesting/) | [🦋BlueSky](https://bsky.app/profile/undercode.bsky.social)


