Listen to this Post
Introduction:
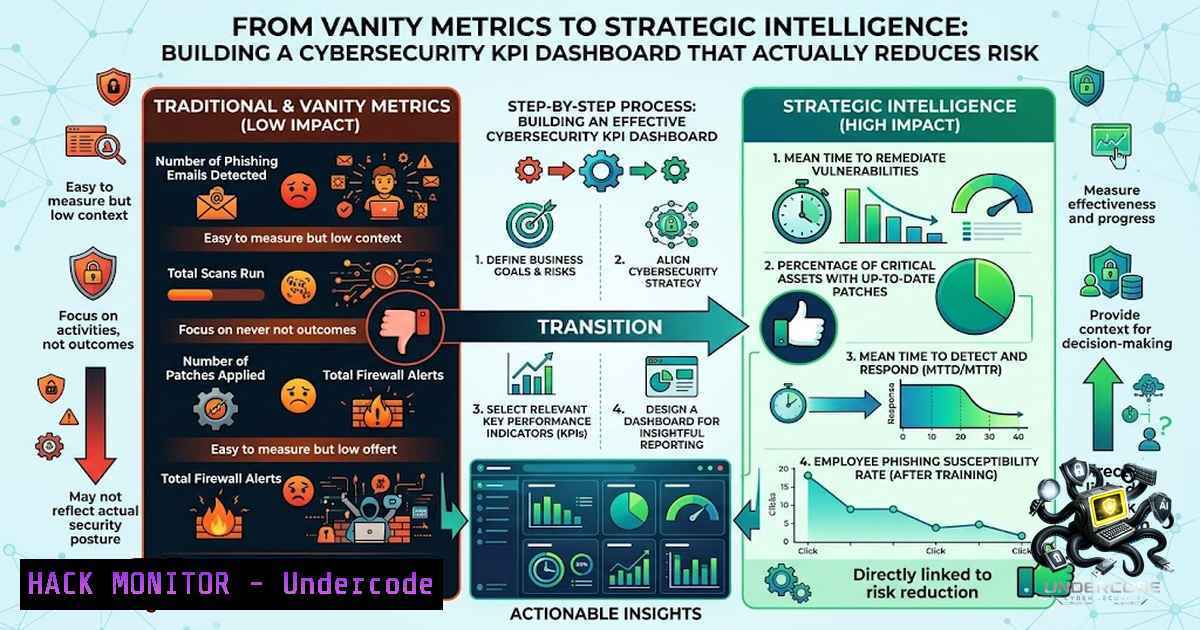
Cybersecurity leaders are drowning in data but starved for insight. The typical security dashboard is cluttered with activity metrics—number of alerts, patches deployed, scans run—that measure effort, not effectiveness. Yet the boardroom doesn’t care how many vulnerabilities were found; it cares whether material cyber risk is being reduced, whether controls are performing as intended, and whether the organization can detect, respond, and recover fast enough when an attack occurs. Bridging this gap requires a disciplined KPI framework that connects technical operations directly to business risk—and the 21 KPIs outlined in the Cybersecurity Excel Dashboard Suite provide exactly that blueprint.
Learning Objectives:
- Master the distinction between vanity metrics and actionable KPIs that drive security investment decisions
- Implement a measurement framework across cyber risk closure, attack surface reduction, and incident response effectiveness
- Deploy automated data collection and visualization techniques using Excel, PowerShell, Python, and cloud APIs
- Quantify emerging risks including shadow AI, cloud misconfigurations, and supply-chain vulnerabilities
You Should Know:
- Cyber Risk Closure & Asset Visibility – Measuring What You Can’t Protect
The foundation of any security program is knowing what you own and how exposed it is. The Cyber Risk Register and Asset Visibility KPI tracks the percentage of assets with complete security posture data (ownership, location, criticality, patch status) and the rate at which identified risks are remediated. Without this baseline, every other metric is guesswork.
Step‑by‑step guide to build an asset risk closure dashboard:
Step 1: Inventory discovery. Run network scans using Nmap or use your CMDB/cloud asset inventory APIs to export all known assets.
 Windows: Export AD computers with last logon
Get-ADComputer -Filter  -Properties LastLogonDate, OperatingSystem |
Select-Object Name, OperatingSystem, LastLogonDate |
Export-Csv -Path "C:\Security\asset_inventory.csv" -1oTypeInformation
 Linux: Discover live hosts and open ports
nmap -sn 192.168.1.0/24 -oG - | awk '/Up$/{print $2}' > asset_list.txt
 For deeper OS and service detection
nmap -O -sV -iL asset_list.txt -oA full_asset_scan
Step 2: Classify criticality. Tag each asset as Critical, High, Medium, or Low based on the data it processes or its role in business operations. Use Excel’s conditional formatting to color-code.
Step 3: Calculate risk closure rate. Define the formula:
Risk Closure Rate (%) = (Closed Risks / Total Identified Risks) × 100
Track this weekly. A rate below 80% for critical risks should trigger executive escalation.
Step 4: Automate refresh. Use Power Query in Excel to pull fresh data from your SIEM, vulnerability scanner, or CMDB daily. Configure data connections to Qualys, Tenable, or AWS Config APIs.
- Attack Surface & Vulnerability Exposure – Prioritizing What Matters
Not all vulnerabilities are equal. The KEV (Known Exploited Vulnerabilities) and secure configuration compliance metrics force discipline by focusing on vulnerabilities with active exploits in the wild, not just CVSS scores. This KPI answers: “What percentage of our exposed assets have patches for KEV-listed vulnerabilities applied within the SLA window?”
Step‑by‑step guide to KEV‑driven vulnerability management:
Step 1: Pull CISA KEV catalog. Use the official CISA Known Exploited Vulnerabilities JSON feed.
import requests
import json
import pandas as pd

url = "https://www.cisa.gov/sites/default/files/feeds/known_exploited_vulnerabilities.json"
response = requests.get(url)
kev_data = response.json()

Extract CVE IDs
kev_cves = [item['cveID'] for item in kev_data['vulnerabilities']]
print(f"Total KEV entries: {len(kev_cves)}")
Step 2: Cross-reference with your vulnerability scan results. Export scan data from Tenable, Qualys, or Rapid7. Filter for CVEs that appear in both your environment and the KEV list.
 PowerShell: Compare scan results with KEV list
$scanResults = Import-Csv "C:\Security\vuln_scan.csv"
$kevList = Get-Content "C:\Security\kev_cves.txt"
$criticalExposures = $scanResults | Where-Object { $_.CVE -in $kevList }
$criticalExposures | Export-Csv "C:\Security\critical_kev_exposures.csv"
Step 3: Calculate exposure score.
KEV Exposure Score = (Number of KEV vulnerabilities present / Total assets) × 100
Track this daily. A rising score indicates increasing organizational risk.
Step 4: Build SLA tracking. In Excel, add columns for “Detection Date,” “SLA Remediation Deadline,” and “Remediation Date.” Use conditional formatting to flag overdue items in red.
- Phishing-Resistant MFA & Privileged Access Reviews – The Identity Perimeter
Over 99.9% of compromised accounts lack MFA, making this one of the highest-ROI security investments. But not all MFA is equal. The Phishing-Resistant MFA KPI measures the percentage of users (especially privileged ones) protected by FIDO2/WebAuthn, passkeys, or PKI-based authenticators rather than SMS or OTP, which are vulnerable to interception and social engineering.
Step‑by‑step guide to measuring MFA maturity:
Step 1: Inventory authentication methods. Export from your identity provider (Azure AD, Okta, Google Workspace).
 Azure AD: Get MFA registration status
Connect-MgGraph -Scopes "User.Read.All", "AuditLog.Read.All"
$users = Get-MgUser -All
$mfaStatus = @()
foreach ($user in $users) {
$methods = Get-MgUserAuthenticationMethod -UserId $user.Id
$hasMfa = $methods | Where-Object { $_.AdditionalProperties -match "mfa" }
$mfaStatus += [bash]@{
User = $user.UserPrincipalName
MFAEnabled = ($hasMfa -1e $null)
}
}
$mfaStatus | Export-Csv "C:\Security\mfa_status.csv"
Step 2: Classify MFA methods. Flag SMS and voice as “non-resistant.” Flag TOTP as “moderately resistant.” Flag FIDO2/WebAuthn as “phishing-resistant.”
Step 3: Calculate MFA maturity score.
Phishing-Resistant MFA Coverage (%) = (Users with FIDO2/WebAuthn / Total users) × 100
Step 4: Privileged access review. For all admin accounts, enforce a quarterly recertification process. Track the percentage of privileged accounts reviewed within the last 90 days.
- Endpoint Detection & Logging Coverage – Closing the Visibility Gap
You can’t detect what you can’t see. The Endpoint Detection and Logging Coverage KPI measures the percentage of endpoints with EDR agents installed, actively reporting, and with full logging enabled (Windows Event Logging, Sysmon, or equivalent). This is the bedrock of detection engineering.
Step‑by‑step guide to audit and improve logging coverage:
Step 1: Query EDR console API. Use your EDR vendor’s API (CrowdStrike, SentinelOne, Microsoft Defender) to export a list of all enrolled endpoints and their last check-in time.
 Example: Microsoft Defender API - get machine status
import requests

tenant_id = "your-tenant-id"
client_id = "your-client-id"
client_secret = "your-client-secret"

Authenticate
token_url = f"https://login.microsoftonline.com/{tenant_id}/oauth2/token"
token_data = {
"grant_type": "client_credentials",
"client_id": client_id,
"client_secret": client_secret,
"resource": "https://api.security.microsoft.com"
}
token_response = requests.post(token_url, data=token_data)
access_token = token_response.json()['access_token']

Get machines
headers = {"Authorization": f"Bearer {access_token}"}
machines_url = "https://api.security.microsoft.com/api/machines"
machines_response = requests.get(machines_url, headers=headers)
machines = machines_response.json()['value']

Filter for machines with active sensors
active = [m for m in machines if m['healthStatus'] == 'Active']
coverage = (len(active) / len(machines))  100
print(f"EDR Coverage: {coverage:.2f}%")
Step 2: Enable advanced Windows logging. Deploy via Group Policy or PowerShell:
 Enable PowerShell logging
Set-ItemProperty -Path "HKLM:\SOFTWARE\Policies\Microsoft\Windows\PowerShell\ScriptBlockLogging" -1ame "EnableScriptBlockLogging" -Value 1

Enable Sysmon (download from Microsoft Sysinternals)
 Install Sysmon with a comprehensive configuration
sysmon64.exe -accepteula -i sysmonconfig.xml
Step 3: Calculate coverage score.
Logging Coverage (%) = (Endpoints with full logging enabled / Total endpoints) × 100
Target >95% for all production assets.
- Mean Time to Detect, Contain, and Recover – The Incident Response Trifecta
These three KPIs—MTTD, MTTC, and MTTR—are the most direct measure of security operational effectiveness. MTTD measures the average time from initial compromise to detection; MTTC measures time from detection to containment (stopping the attack’s spread); MTTR measures time to full recovery and restoration of normal operations. Organizations with MTTD under 1 hour and MTTC under 4 hours demonstrate mature SOC capabilities.
Step‑by‑step guide to calculate and improve incident response times:
Step 1: Extract incident timeline data from your SIEM or case management system (ServiceNow, Jira, TheHive).
-- Example SQL query for MTTD from a SIEM database
SELECT
AVG(DATEDIFF(minute, compromise_time, detection_time)) AS avg_MTTD,
AVG(DATEDIFF(minute, detection_time, containment_time)) AS avg_MTTC,
AVG(DATEDIFF(minute, containment_time, recovery_time)) AS avg_MTTR
FROM incidents
WHERE incident_date >= DATEADD(month, -3, GETDATE())
Step 2: Identify bottlenecks. Break down each phase. Is detection slow because logs are missing? Is containment slow because playbooks are undefined? Is recovery slow because backups are untested?
Step 3: Implement automated containment. Use SOAR playbooks to auto-isolate compromised endpoints.
 Example: CrowdStrike Falcon API - isolate endpoint
import requests

base_url = "https://api.crowdstrike.com"
headers = {"Authorization": f"Bearer {api_token}"}

Isolate a host by device ID
isolate_payload = {
"ids": ["device_id_here"],
"action_parameters": [{"name": "reason", "value": "Suspicious activity detected"}]
}
response = requests.post(
f"{base_url}/devices/entities/devices-actions/v2?action_name=contain",
headers=headers,
json=isolate_payload
)
Step 4: Track trends monthly. Publish a rolling 90-day average to leadership. Celebrate improvements; investigate regressions.
6. Cloud Misconfiguration Exposure – The New Perimeter
Cloud misconfigurations remain the 1 cause of cloud breaches. The Cloud Misconfiguration Exposure KPI tracks the number of critical misconfigurations (publicly exposed storage, overly permissive IAM roles, unencrypted data) and the mean time to remediate them. A single open S3 bucket can expose terabytes of sensitive data.
Step‑by‑step guide to measure and remediate cloud misconfigurations:
Step 1: Use CSPM tools. Deploy Cloud Security Posture Management (CSPM) tools like AWS Security Hub, Azure Security Center, or third-party solutions (Wiz, Orca, Tenable).
Step 2: Export findings via API.
 AWS: List S3 buckets with public access
import boto3

s3 = boto3.client('s3')
buckets = s3.list_buckets()['Buckets']

public_buckets = []
for bucket in buckets:
try:
acl = s3.get_bucket_acl(Bucket=bucket['Name'])
for grant in acl['Grants']:
if 'URI' in grant['Grantee'] and 'AllUsers' in grant['Grantee']['URI']:
public_buckets.append(bucket['Name'])
break
except Exception as e:
print(f"Error checking {bucket['Name']}: {e}")

print(f"Publicly accessible buckets: {public_buckets}")
Step 3: Calculate exposure score.
Cloud Misconfiguration Exposure = Number of critical (high-severity) misconfigurations
Track this weekly. Remediate critical findings within 24 hours.
Step 4: Implement Infrastructure as Code (IaC) scanning. Use tools like Checkov or Terrascan to scan Terraform/CloudFormation templates before deployment, preventing misconfigurations from reaching production.
- Shadow AI & Emerging Data-Leakage Exposure – The Uncontrolled Frontier
Shadow AI—the use of unauthorized AI tools by employees—has exploded, with 63% of employees using AI tools without IT approval. Each user creates an average of 5.8 new data exposure points per week as they paste sensitive data into public LLMs. The Shadow AI Exposure KPI measures the percentage of corporate data interactions occurring with unapproved AI platforms and the number of sensitive data leakage incidents detected.
Step‑by‑step guide to measure and control shadow AI risk:
Step 1: Deploy DLP and CASB controls. Configure Data Loss Prevention (DLP) policies to detect and block sensitive data (credit cards, PII, source code) being uploaded to unauthorized AI platforms.
Step 2: Monitor network traffic for AI platform usage. Use proxy logs or DNS monitoring.
 PowerShell: Extract AI platform traffic from proxy logs
$proxyLogs = Import-Csv "C:\Security\proxy_logs.csv"
$aiDomains = @("chat.openai.com", "claude.ai", "gemini.google.com", "deepseek.com")
$shadowAiUsage = $proxyLogs | Where-Object { $_.Domain -in $aiDomains }
$shadowAiUsage | Group-Object User | Select-Object Name, Count | Export-Csv "C:\Security\shadow_ai_usage.csv"
Step 3: Calculate exposure metric.
Shadow AI Data Leakage Incidents = Number of DLP alerts triggered by AI platform uploads
Track weekly. An increasing trend signals the need for approved, secure AI alternatives and user training.
Step 4: Implement an approved AI gateway. Deploy a secure AI proxy that logs, inspects, and controls all AI traffic, providing visibility while enabling safe usage.
What Undercode Say:
- Key Takeaway 1: Security metrics are not an end in themselves—they are decision-support tools. The most effective KPIs are those that directly inform investment decisions, such as “What percentage of our budget is going to controls that reduce our top three risks?” rather than “How many alerts did we generate?”
-
Key Takeaway 2: The 21 KPIs in this framework are deliberately cross-functional. They span technical operations (MTTD/MTTC), governance (risk closure, compliance), and emerging threats (shadow AI, cloud misconfigurations). This forces security teams to think holistically and prevents siloed optimization that misses the bigger picture.
Analysis: The shift from activity-based to outcome-based metrics represents a maturation of the cybersecurity profession. For too long, security leaders have presented dashboards full of green checkmarks that impressed no one in the boardroom. The new paradigm—exemplified by the KEV-focused vulnerability management, phishing-resistant MFA adoption rates, and cloud misconfiguration exposure scores—directly answers the three questions every CEO and board member cares about: Are we safer than last quarter? Are our controls working? Can we survive a breach? Organizations that adopt this measurement framework will not only improve their security posture but also gain a competitive advantage by demonstrating tangible risk reduction to customers, regulators, and insurers. Conversely, those that cling to vanity metrics will find themselves unable to justify security spend and increasingly exposed to preventable breaches.
Prediction:
- -1: By 2027, organizations that fail to implement KEV-based vulnerability prioritization will experience breaches that could have been prevented with known patches, leading to regulatory fines and shareholder lawsuits. The window for remediation is closing as attackers automate exploitation of newly published KEVs within hours.
-
+1: The convergence of cybersecurity KPIs with business risk quantification will give rise to a new role—the Cyber Risk Quantification Analyst—who sits at the intersection of security, finance, and operations. This role will command premium salaries and become a standard hire in Fortune 500 companies by 2028.
-
-1: Shadow AI exposure will become the 1 source of data leakage incidents within 18 months, surpassing phishing, as employees continue to paste proprietary code and customer data into public LLMs. Organizations without DLP controls specifically tuned for AI platforms will face a cascade of breaches and compliance violations.
-
+1: Automated, API-driven KPI dashboards will replace manual Excel reporting within three years, with real-time data feeds from SIEMs, CSPM tools, and identity providers enabling continuous risk scoring. This will free security teams from spreadsheet drudgery and allow them to focus on analysis and remediation.
-
-1: The average MTTD will continue to rise for organizations that do not invest in automated detection and response, as attack volumes and complexity outpace manual investigation capabilities. By 2028, the gap between high-maturity and low-maturity organizations in incident response times will widen to a factor of 10x or more.
-
+1: Phishing-resistant MFA (FIDO2/WebAuthn) will become the de facto standard for all privileged and customer-facing accounts by 2027, driven by both regulatory mandates (e.g., new SEC rules, NIS2) and the compelling ROI of preventing account takeover. This will effectively eliminate password-based credential theft as a primary attack vector.
-
+1: The integration of MITRE ATT&CK coverage metrics into SOC KPIs will enable security teams to measure and improve detection engineering with unprecedented precision, shifting from reactive alert-firing to proactive threat-informed defense.
▶️ Related Video (78% Match):
https://www.youtube.com/watch?v=6ff6sOIgWdE
🎯Let’s Practice For Free:
🎓 Live Courses & Certifications:
Join Undercode Academy for Verified Certifications
🚀 Request a Custom Project:
Secure, high-velocity infrastructure and disruptive technological engineering. Contact our engineering team for high-tier development and proprietary systems:
[email protected]
💎 Smart Architecture | 🛡️ Secure by Design | ⭐ Trusted by Thousands
IT/Security Reporter URL:
Reported By: Cybersecurity Cyberrisk – Hackers Feeds
Extra Hub: Undercode MoN
Basic Verification: Pass ✅


