Listen to this Post
Introduction:
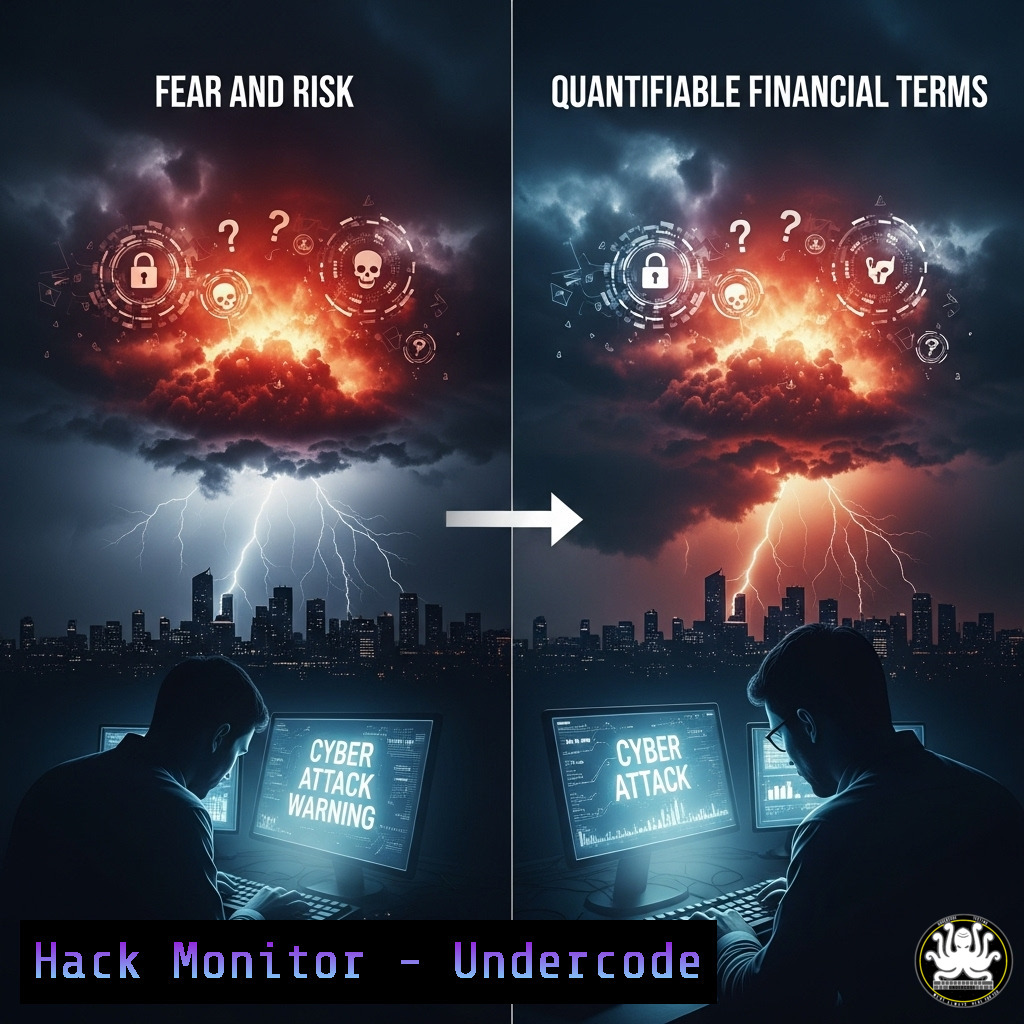
The era of the CISO using fear, uncertainty, and doubt (FUD) to secure budget is over. Modern cybersecurity leadership requires translating technical risk into clear financial terms that resonate with the CFO and board. This shift from being a “tool-pusher” to a strategic advisor is critical for aligning security investments with business objectives and demonstrating tangible return on investment (ROI) in resilience.
Learning Objectives:
- Understand how to quantify cyber risk in financial terms, such as calculating Annualized Loss Expectancy (ALE) and Risk Reduction ROI.
- Learn to utilize frameworks like the NIST Cybersecurity Framework (CSF) to map security controls directly to business impact and financial exposure.
- Master the technical and analytical commands to gather data that supports your financial arguments, from asset valuation to threat likelihood.
You Should Know:
- Quantifying Asset Value and Single Loss Expectancy (SLE)
Before you can calculate risk, you must value your assets. This involves identifying critical systems and the financial impact of their compromise.
Command (Linux):
 Use systemd to list all running services, a potential starting point for critical asset inventory.
systemctl list-units --type=service --state=running
 Query installed packages on a Debian-based system to understand software assets.
dpkg-query -l
Step-by-step guide:
The first step to financial clarity is asset identification and valuation. The `systemctl` command provides a list of all active services, which are often components of critical business applications. The `dpkg-query` command helps inventory software assets. Once identified, work with business units to assign a monetary value to these assets. This value, combined with the cost of a single security incident (downtime, data loss, recovery costs), helps you calculate the Single Loss Expectancy (SLE = Asset Value x Exposure Factor).
2. Calculating Annualized Rate of Occurrence (ARO)
Risk is not just about impact, but also likelihood. The ARO estimates how often a specific threat is expected to occur in a year.
Command (Linux – Using `journalctl` for log analysis):
 Count the number of failed SSH login attempts in the last 30 days to gauge brute force attempt frequency.
journalctl _SYSTEMD_UNIT=ssh.service --since="30 days ago" | grep "Failed password" | wc -l
 Analyze web server logs for common attack patterns (e.g., SQL injection probes).
sudo tail -1000 /var/log/nginx/access.log | grep -E "union.select|%27|%20or%20" | wc -l
Step-by-step guide:
Use log analysis to move from anecdotal evidence to data-driven threat likelihood. The `journalctl` command filters systemd logs for the SSH service, and the grep pipe counts “Failed password” entries, providing a raw count of brute-force attempts. Similarly, querying web server logs for common attack strings can show the frequency of application-level attacks. Dividing these counts by the time period analyzed gives a baseline frequency, which can be extrapolated to an annual rate to inform your ARO.
3. The Core Formula: Annualized Loss Expectancy (ALE)
The ALE is the cornerstone of financial risk communication. It provides a clear, annual expected financial loss for a specific threat.
Formula & Calculation:
`ALE = SLE x ARO`
Example:
If a critical server (asset value: $500,000) has a 25% exposure factor from a ransomware attack (SLE = $125,000), and log analysis shows such an attack is likely to occur once every five years (ARO = 0.2), then the ALE is $125,000 x 0.2 = $25,000.
This $25,000 figure is what you present to leadership: “We expect to lose $25,000 per year to this threat.”
4. Calculating Risk Reduction ROI for a Control
Now, prove the value of a proposed security investment. Calculate how much risk a control mitigates and its cost-effectiveness.
Formula:
`ROI = (ALE Before Control – ALE After Control) – Cost of Control`
`Cost of Control`
Example:
Proposing a $10,000 EDR solution that reduces the likelihood of the ransomware attack (ARO) from 0.2 to 0.05.
ALE Before = $25,000
ALE After = $125,000 (SLE) x 0.05 (new ARO) = $6,250
Annual Risk Reduction = $25,000 – $6,250 = $18,750
ROI = ($18,750 – $10,000) / $10,000 = 0.875 (or 87.5% in the first year)
This translates to: “For a $10,000 investment, we reduce our annual expected loss by $18,750, yielding an 87.5% ROI in year one.”
- Mapping Controls to the NIST CSF for Framework Clarity
Use the NIST CSF to structure your arguments in a universally recognized governance language.
Activity:
Map your proposed controls to the NIST CSF Core Functions (Identify, Protect, Detect, Respond, Recover). For the EDR example:
Identify: The tool helps inventory software and processes (Asset Management).
Protect: It can block malicious activity.
Detect: Its primary function is continuous monitoring and anomaly detection.
Respond & Recover: It provides isolation and remediation capabilities.
Presenting your $10,000 EDR investment as a solution that addresses 4 out of 5 NIST CSF functions demonstrates strategic alignment with best practices, moving the conversation beyond mere cost.
6. Technical Validation: Verifying Control Effectiveness
Before buying, test. Use penetration testing tools to validate the current state of security and re-test after a control is implemented to measure efficacy.
Command (Using `nmap` for vulnerability surface assessment):
 Perform a basic SYN scan to identify open ports on a target system.
nmap -sS [bash]
 Script scanning to check for common vulnerabilities on discovered services.
nmap -sC -sV -O [bash]
 Test if a host is vulnerable to a specific CVE (e.g., EternalBlue MS17-010).
nmap --script smb-vuln-ms17-010 [bash]
Step-by-step guide:
Use `nmap` to objectively measure your attack surface before and after implementing a security control like a new firewall or patch management system. The `-sS` command performs a stealthy port scan. The `-sC -sV` flags run default scripts and probe service versions, revealing potential vulnerabilities. By running identical scans pre- and post-implementation, you can provide quantitative evidence of risk reduction (e.g., “We reduced exposed high-risk services from 15 to 2”), directly supporting your financial models.
7. Continuous Monitoring with Windows Event Logs
Financial risk is dynamic. Continuous monitoring provides the data needed to keep your ARO and ALE figures current and credible.
Command (Windows PowerShell):
 Query the Security log for specific event IDs related to failed logons (4625).
Get-WinEvent -FilterHashtable @{LogName='Security'; ID=4625} -MaxEvents 10
 Query for successful logons (4624) to sensitive accounts like Administrator.
Get-WinEvent -FilterHashtable @{LogName='Security'; ID=4624} | Where-Object {$_.Message -like "Administrator"}
 Export data to CSV for further analysis in tools like Excel or Power BI.
Get-WinEvent -FilterHashtable @{LogName='Security'; ID=4625} | Select-Object TimeCreated, Message | Export-CSV -Path "C:\logs\FailedLogons.csv" -NoTypeInformation
Step-by-step guide:
Windows Event Logs are a goldmine for validating threat activity. These PowerShell commands allow you to extract specific security-related events. Tracking failed logons (Event ID 4625) helps refine your ARO for brute-force attacks. Monitoring successful logons by privileged accounts (Event ID 4624) is crucial for detecting compromise. Exporting this data to CSV allows for trend analysis over time, providing concrete, auditable data to back up your risk assessments and show the ongoing value of your security program.
What Undercode Say:
- Key Takeaway 1: The modern CISO’s primary currency is not fear, but financial quantification. Mastering formulas like ALE and Risk Reduction ROI is no longer optional; it is the fundamental language required to secure budget and executive buy-in.
- Key Takeaway 2: Technical commands and tools are not just for operational security; they are critical for generating the data that fuels financial models. Log analysis, penetration testing results, and asset inventories provide the objective evidence needed to move the conversation from subjective “what-ifs” to objective “what-is.”
The analysis reveals a definitive industry shift. The commentary from cybersecurity leaders universally condemns FUD-based strategies, emphasizing that trust and long-term relationships are built on clarity and measurable impact. The technical commands provided are the bridge—they are the mechanisms CISOs and their teams use to gather the raw data that must then be translated into business terms. Frameworks like NIST CSF are the translation layer, providing a structured way to align technical controls with business-driven outcomes. The CISO who can run an `nmap` scan, analyze the results into an updated ALE, and present the risk reduction ROI within the NIST framework is the one who will successfully align security with business strategy and win every budget debate.
Prediction:
The future of cybersecurity leadership will be dominated by data-driven, financially fluent CISOs. Within five years, the inability to articulate risk in financial terms and demonstrate clear ROI will render a CISO obsolete. We will see the rise of dedicated “Cyber Risk Quantification” platforms that integrate directly with security tools (EDR, SIEM, vuln scanners) to automatically calculate ALE and ROI for proposed security controls in real-time. Board decks will feature dynamic risk heat maps tied directly to financial statements, and cybersecurity will finally be managed as the financial risk it truly is, fundamentally changing how organizations fund and prioritize their security programs.
🎯Let’s Practice For Free:
IT/Security Reporter URL:
Reported By: Nicknolen Ciso – Hackers Feeds
Extra Hub: Undercode MoN
Basic Verification: Pass ✅


