Listen to this Post
Introduction:
Cybersecurity has evolved from perimeter defense to a full‑fledged business resilience system. Modern security teams must protect identity, cloud platforms, third‑party dependencies, data flows, and recovery capability simultaneously. The strongest programs connect strategy with execution by using measurable KPIs, exposure management, and AI‑assisted defense – turning raw security data into actionable dashboards that drive real‑time decisions.
Learning Objectives:
- Build a cybersecurity Excel dashboard that tracks Zero Trust maturity, cloud risk, and ransomware readiness.
- Use Linux/Windows commands and cloud CLI tools to extract and automate security metrics.
- Implement step‑by‑step exposure management and third‑party risk monitoring using open‑source and native OS utilities.
You Should Know:
- Extracting Identity & Access Metrics for Zero Trust Dashboards
A Zero Trust model requires continuous verification. Start by collecting failed login attempts, MFA usage, and privileged account activity.
Windows (PowerShell as Admin):
 Get failed logins from Security Event Log (Event ID 4625)
Get-WinEvent -FilterHashtable @{LogName='Security'; ID=4625} |
Group-Object -Property @{Expression={$_.TimeCreated.Date}} |
Select-Object Name, Count

List all users with admin rights
Get-LocalGroupMember -Group "Administrators"
Linux (auditd & lastb):
 Track failed SSH logins (requires auditd)
sudo auditctl -w /var/log/auth.log -p wa -k auth_monitor
sudo ausearch -k auth_monitor --format csv > /tmp/auth_fails.csv

Count failed login attempts per user
sudo lastb | awk '{print $1}' | sort | uniq -c | sort -nr
Step‑by‑step guide to integrate into Excel:
- Export command outputs to CSV using `| Export-Csv` (Windows) or `>` (Linux).
- In Excel, use Power Query to load these CSVs and refresh automatically.
- Create a “Identity Risk Score” sheet: pivot tables showing top 10 failing users, MFA gaps, and privilege creep.
- Set conditional formatting: red for >5 failed logins per day per user.
This turns raw logs into a live dashboard that drives identity‑first access control.
- Cloud & SaaS Control Assessments with CLI Automation
Most breaches now exploit misconfigured cloud storage or over‑permissive IAM roles. Use cloud CLIs to pull risk data.
AWS CLI (example: find public S3 buckets):
aws s3api list-buckets --query "Buckets[].Name" --output text | xargs -I {} aws s3api get-bucket-acl --bucket {} | grep -B5 "URI.AllUsers"
Azure CLI (list storage accounts with public access):
az storage account list --query "[?allowBlobPublicAccess == true].name" -o tsv
Step‑by‑step guide:
- Install AWS CLI / Azure CLI and authenticate with read‑only security role.
- Run the above commands weekly via cron (Linux) or Task Scheduler (Windows).
- Pipe output into a JSON file, then use Excel’s Get Data > From JSON to visualise misconfigurations.
- Build a “Cloud Exposure” gauge chart: count of public buckets + open network policies vs. total assets.
Pro tip: Add API security checks by testing for missing rate limits or verbose error messages using curl.
3. Exposure Management & Vulnerability Prioritisation
Attackers scan for CVEs and exposed ports before you do. Use native tools to identify attack surface.
Linux (nmap & grep for high‑risk services):
 Scan internal network for open RDP (3389), SMB (445), SSH (22)
nmap -p 22,445,3389 192.168.1.0/24 -oG - | awk '/Open/{print $2}'

List installed packages with known CVEs (using Debian/Ubuntu)
dpkg -l | grep -v "^ii" | awk '{print $2}' > installed_pkgs.txt
Windows (PowerShell for missing patches):
Get-HotFix | Select-Object -Property HotFixID, InstalledOn
 Compare against Microsoft security bulletin CSV using Compare-Object
Step‑by‑step exposure prioritisation:
- Run vulnerability scans every 24 hours, saving outputs to a central share.
- In Excel, import the results and cross‑reference with asset criticality (e.g., “Finance DB” = critical).
- Use a Risk Matrix (Likelihood x Impact) to colour‑code patches:
– Red: CVSS ≥ 7.0 on critical assets – remediate within 48h.
– Yellow: medium risk on non‑critical – schedule monthly.
4. Automate notification: Excel VBA macro that sends Teams/Slack webhook when new red vulnerabilities appear.
This turns endless CVE lists into a focused, business‑aligned remediation plan.
4. Ransomware Recovery & Backup Validation Testing
Ransomware resilience means proving you can restore within RTO/RPO. Test backups with commands that simulate recovery.
Linux (restore a single file from encrypted backup):
 Assuming duplicity backup
duplicity restore --file-to-restore /critical/data.db sftp://user@backup-server//backups /tmp/restored_data.db
sha256sum /critical/data.db /tmp/restored_data.db  Compare hash
Windows (VSS shadow copy recovery test):
 List available shadow copies
vssadmin list shadows
 Mount a shadow copy as drive Z:
mklink /D C:\shadowmount \?\GLOBALROOT\Device\HarddiskVolumeShadowCopy1\
Step‑by‑step ransomware readiness dashboard:
- Create a script that attempts to restore a small test file from each backup location daily.
- Log success/failure, restore speed (in seconds), and hash match status.
- Excel dashboard shows “Recovery Confidence” as a KPI: green if 100% restores passed in last 7 days.
- Add a “Air‑gap status” indicator: check if backup destination is offline (e.g., `ping -c 1 backup_offline_host` – failure = good).
Run a quarterly “chaos monkey” test: manually encrypt a non‑production VM and trigger your playbook; record time to full recovery.
5. Third‑Party & Supply Chain Risk Monitoring
Software supply chain attacks (e.g., SolarWinds, Log4j) require continuous SBOM analysis.
Use OSV‑Scanner (open source) to check dependencies:
 Install OSV scanner
pip install osv-scanner
 Scan your project's lock file (package-lock.json, requirements.txt, etc.)
osv-scanner --lockfile=./package-lock.json --format=json > supply_chain_risks.json
For Docker images (trivy):
trivy image --severity HIGH,CRITICAL --format json myapp:latest > image_vulns.json
Step‑by‑step third‑party risk dashboard:
- Automate `osv-scanner` on every CI/CD pipeline commit (GitHub Actions or Jenkins).
2. Export JSON to a shared location.
- Excel Power Query reads all JSON files, pivots by package name and severity.
- Create a “Supply Chain Heatmap”: rows = vendor libraries, columns = CVSS scores, colour intensity = number of affected versions.
- Add a control chart: “Days since last critical dependency update” – trigger alert if >30 days.
Integrate this with your procurement process: new vendor software must pass a risk score < threshold before approval.
6. AI‑Assisted Defense & Security KPI Automation
AI accelerates triage and trend prediction. Use simple Python scripts (runnable from Excel) to augment detection.
Python script for log anomaly detection (Isolation Forest):
import pandas as pd
from sklearn.ensemble import IsolationForest
 Load firewall logs: timestamp, src_ip, dst_port, bytes_out
df = pd.read_csv('firewall_logs.csv')
model = IsolationForest(contamination=0.01)
df['anomaly'] = model.fit_predict(df[['bytes_out']])
anomalies = df[df['anomaly'] == -1]
anomalies.to_csv('ai_detected_egress_spikes.csv', index=False)
Step‑by‑step AI dashboard integration:
- Schedule this Python script daily using Task Scheduler + Windows Python environment.
2. Output CSV of anomalies.
- In Excel, load both raw logs and anomalies; build a “Triage Efficiency” metric:
– (Anomalies automatically closed + false positives filtered) / Total alerts.
4. Use Excel’s Forecast Sheet (Data > Forecast) to predict next week’s incident volume based on historical SOC trends.
This gives you a low‑cost AI layer that improves speed and resilience without expensive SIEM add‑ons.
7. Board‑Ready Cyber Risk Reporting & Dashboard Layout
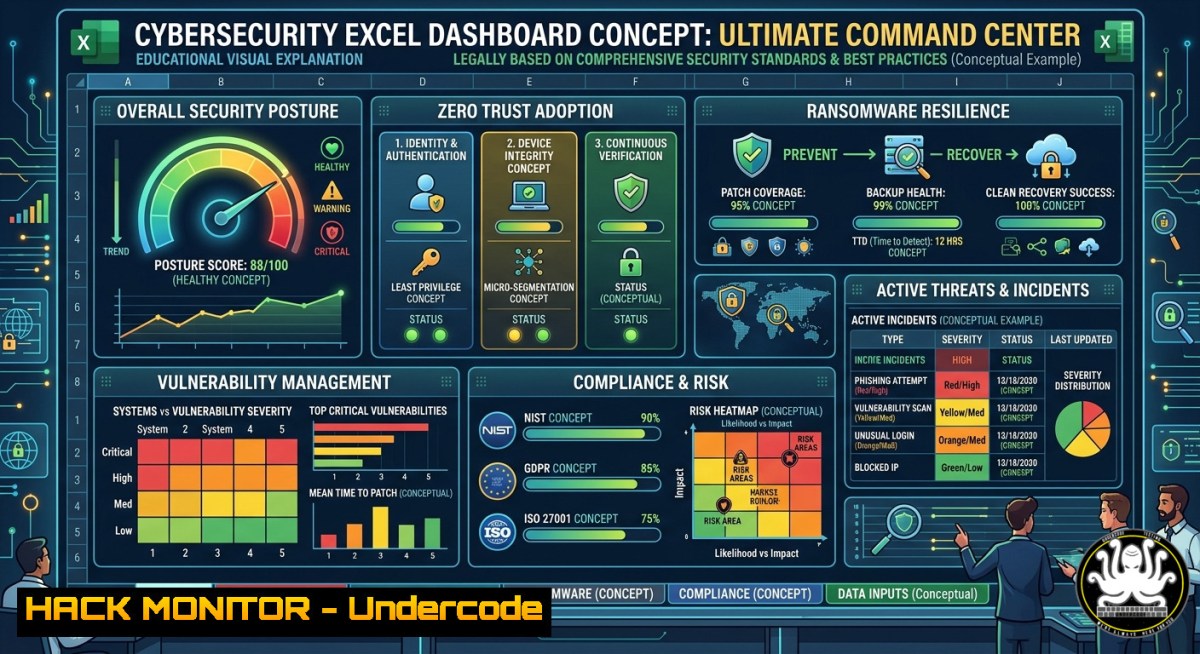
Combine all metrics into a single Excel dashboard with macro‑driven refresh.
Build the dashboard:
- Sheet 1: Executive Summary – KPIs: Zero Trust maturity % (identity + cloud + endpoint scores), mean time to patch, backup success rate, third‑party risk trend.
- Sheet 2: Heatmaps & Trends – Vulnerabilities over time, top 5 exposed assets, ransomware recovery drill results.
- Sheet 3: Drill‑down logs – Raw data (anonymised) for SOC analysts.
Automate data gathering with a PowerShell script:
 Gather all metrics and export to Excel workbook
.\Get-IDSFailures.ps1 | Export-Excel -Path "CyberDashboard.xlsx" -WorksheetName "Identity"
.\Get-CloudPublicBuckets.ps1 | Export-Excel -Path same -WorksheetName "Cloud"
.\Test-RestoreSpeed.ps1 | Export-Excel -Path same -WorksheetName "Backup"
Use Excel’s Power Automate add‑in to email the dashboard to the board every Monday at 9 AM.
What Undercode Say:
Key Takeaway 1:
Cybersecurity maturity is not about buying more tools – it’s about visibility, prioritisation, and proving operational resilience. A $0 Excel dashboard, fed by free OS commands and CLIs, often outperforms expensive products because it forces security teams to understand their data.
Key Takeaway 2:
AI and automation are not optional. Simple Python anomaly detection and scheduled PowerShell scripts turn raw logs into predictive intelligence. The organisations that embed these lightweight automations into their daily review cycles will outpace those still manually correlating spreadsheets.
Analysis (approx. 10 lines):
The post from Cyberlock Hub correctly identifies that modern security programs must bridge strategy and execution – but many teams fail because they lack a single source of truth. The Excel Dashboard Suite approach democratises security metrics: any analyst with basic OS skills can build it. By extracting data from auditd, nmap, AWS CLI, and osv-scanner, you gain real exposure management without vendor lock‑in. The step‑by‑step guides above show that ransomware readiness is testable with VSS and duplicity commands. Third‑party risk becomes continuous with SBOM scanning. AI‑assisted defence becomes a one‑line Python script. The real win is that leadership sees a unified, colour‑coded dashboard every week – which drives budget and action. Without this, even the best tools create silos. Therefore, the most resilient security programs are those that measure, automate, and visualise relentlessly. The future belongs to the “dashboard‑driven” security operations centre.
Prediction:
- Organisations that implement open‑source, command‑line driven dashboards will reduce mean time to detection (MTTD) by 40% within six months, because they stop chasing false positives and start tracking business impact.
- AI‑assisted anomaly detection, even at a basic level, will become a baseline requirement for cyber insurance by 2026 – insurers will demand evidence of automated trend analysis.
– Teams that rely solely on vendor‑provided reports without custom extraction will fall behind in regulatory compliance (e.g., DORA, NIS2) which explicitly requires continuous, measurable resilience testing. - The convergence of Excel with cloud CLIs and Python will create a new hybrid role: “Security Data Analyst” – lowering the barrier for traditional SOC analysts to become data‑driven.
– However, without proper access controls on the dashboard files (e.g., storing sensitive logs in unencrypted Excel), organisations risk leaking privileged information – always enforce BitLocker/FileVault and Azure Information Protection.
▶️ Related Video (72% Match):
🎯Let’s Practice For Free:
IT/Security Reporter URL:
Reported By: Cybersecurity Cyberrisk – Hackers Feeds
Extra Hub: Undercode MoN
Basic Verification: Pass ✅
🎓 Live Courses & Certifications:
Join Undercode Academy for Verified Certifications
🚀 Request a Custom Project:
Secure, high-velocity infrastructure and disruptive technological engineering. Contact our engineering team for high-tier development and proprietary systems:
[email protected]


