Listen to this Post
Introduction:
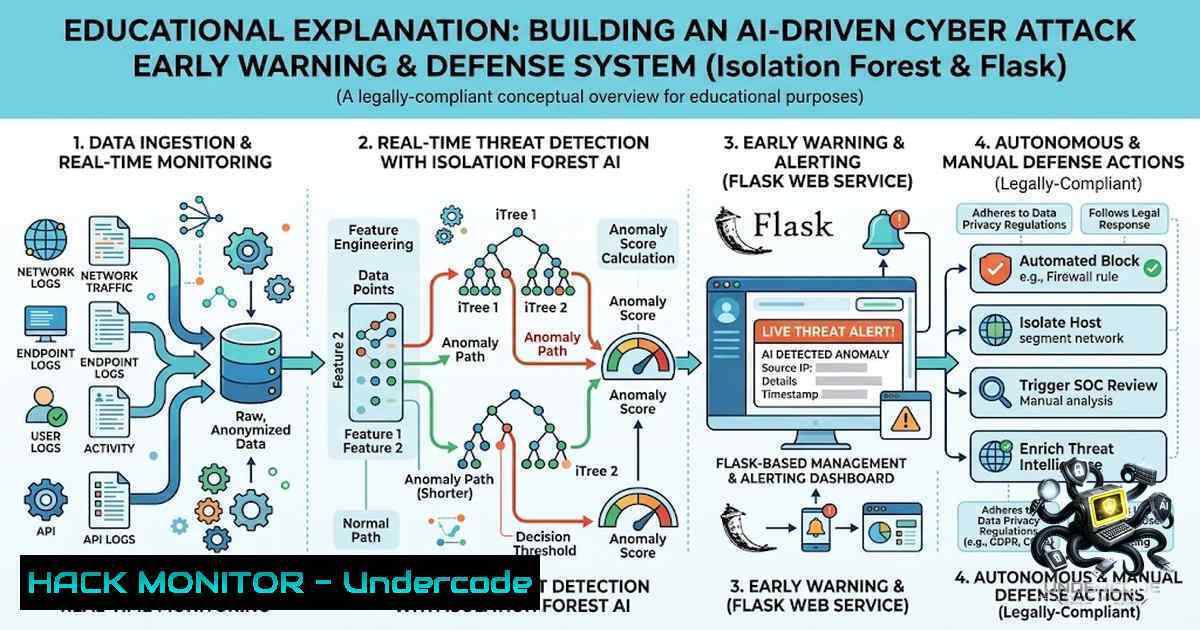
Traditional signature-based intrusion detection systems (IDS) struggle to keep pace with the rapidly evolving threat landscape, often detecting attacks only after they have already breached perimeter defenses. The paradigm is shifting toward proactive defense—leveraging machine learning to identify anomalous network behavior in real time before it escalates into a full-blown security incident. This article presents a comprehensive technical exploration of building a “Cyber Attack Early Warning & Defense System,” an AI-driven solution that combines real-time packet capture, unsupervised anomaly detection using Isolation Forest, a Flask REST API, and an interactive visualization dashboard to create a proactive security monitoring architecture.
Learning Objectives:
- Understand the architecture of an AI-driven early warning system that integrates network monitoring with machine learning for proactive threat detection.
- Learn how to implement and tune the Isolation Forest algorithm for unsupervised anomaly detection in high-dimensional network traffic data.
- Build a real-time data pipeline using Flask REST APIs and WebSocket-based live updates for security dashboards.
- Deploy interactive visualizations using Chart.js and Leaflet to monitor network activity and threat alerts in real time.
1. Real-Time Packet Capture and Network Traffic Ingestion
The foundation of any early warning system is the ability to capture and process network traffic in real time. This involves sniffing packets from a network interface, extracting relevant features, and feeding them into the detection pipeline.
Step‑by‑Step Guide:
1. Set up a packet capture environment:
- On Linux, use `tcpdump` to capture live traffic:
sudo tcpdump -i eth0 -w capture.pcap. - On Windows, use Wireshark or Npcap with the `pcap` library.
2. Install Python dependencies for packet processing:
pip install scapy pandas numpy
3. Write a live packet capture script using Scapy:
from scapy.all import sniff, IP, TCP, UDP
import pandas as pd

packet_data = []

def packet_callback(packet):
if IP in packet:
pkt = {
'src_ip': packet[bash].src,
'dst_ip': packet[bash].dst,
'proto': packet[bash].proto,
'len': len(packet),
'ttl': packet[bash].ttl
}
if TCP in packet:
pkt['sport'] = packet[bash].sport
pkt['dport'] = packet[bash].dport
elif UDP in packet:
pkt['sport'] = packet[bash].sport
pkt['dport'] = packet[bash].dport
packet_data.append(pkt)

Sniff 100 packets on interface eth0
sniff(iface="eth0", prn=packet_callback, count=100)
df = pd.DataFrame(packet_data)
4. Aggregate flows into time-based windows: Group packets by source-destination pairs and time intervals to create flow-level features (e.g., packet count, byte volume, average TTL).
2. ML-Based Anomaly Detection with Isolation Forest
Isolation Forest is an unsupervised learning algorithm that isolates anomalies instead of profiling normal data points. It randomly selects a feature and a split value to partition the data—anomalies require fewer splits to isolate, resulting in shorter path lengths in the ensemble of isolation trees. This makes it particularly effective for high-dimensional network traffic where anomalies are rare and distinct.
Step‑by‑Step Guide:
1. Install scikit-learn:
pip install scikit-learn
2. Train an Isolation Forest model on baseline traffic:
from sklearn.ensemble import IsolationForest
import numpy as np

Assume X_train is a DataFrame of normal network flow features
model = IsolationForest(
n_estimators=100,
max_samples='auto',
contamination=0.01,  expected proportion of outliers
random_state=42
)
model.fit(X_train)
3. Score live traffic in real time:
 X_live is the feature vector from current packet/flow
prediction = model.predict(X_live)  1 = normal, -1 = anomaly
anomaly_score = model.decision_function(X_live)
4. Tune hyperparameters: Adjust `contamination` based on your network’s baseline attack rate, and experiment with `n_estimators` and `max_samples` to balance detection rate and false positives.
5. Implement a two-stage pipeline to reduce false alerts: use Isolation Forest as a first-stage filter, then pass flagged windows to a second-stage classifier (e.g., Random Forest) for verification.
- Building the Flask REST API for Threat Intelligence
A RESTful API serves as the backbone for communication between the detection engine and the frontend dashboard. It exposes endpoints for real-time statistics, alert logs, and configuration updates.
Step‑by‑Step Guide:
1. Set up a Flask application:
pip install flask flask-cors
2. Create API endpoints:
from flask import Flask, jsonify, request
from flask_cors import CORS

app = Flask(<strong>name</strong>)
CORS(app)

alerts = []  in-memory store; use Redis/DB for production

@app.route('/api/stats', methods=['GET'])
def get_stats():
return jsonify({
'total_packets': len(packet_data),
'anomalies_detected': len([a for a in alerts if a['severity'] == 'high']),
'active_connections': active_connections
})

@app.route('/api/alerts', methods=['GET'])
def get_alerts():
return jsonify(alerts[-50:])  last 50 alerts

@app.route('/api/alert', methods=['POST'])
def post_alert():
data = request.json
alerts.append(data)
return jsonify({'status': 'logged'}), 201

if <strong>name</strong> == '<strong>main</strong>':
app.run(host='0.0.0.0', port=5000, debug=True)
3. Integrate with the detection engine: When Isolation Forest flags an anomaly, send a POST request to `/api/alert` with details (timestamp, source/dest IP, protocol, anomaly score).
4. Secure the API: Implement JWT-based authentication for sensitive endpoints and rate limiting to prevent abuse.
4. Interactive Dashboard with Chart.js and Leaflet
Visualization is critical for security analysts to quickly interpret threat data. Chart.js provides real-time charts for traffic trends and attack distribution, while Leaflet offers geographical mapping of attack sources.
Step‑by‑Step Guide:
1. Set up the frontend:
<!DOCTYPE html>
<html>
<head>
<script src="https://cdn.jsdelivr.net/npm/chart.js"></script>
<link rel="stylesheet" href="https://unpkg.com/leaflet/dist/leaflet.css" />
<script src="https://unpkg.com/leaflet/dist/leaflet.js"></script>
</head>
<body>
<canvas id="trafficChart"></canvas>

<div id="map"></div>

<script src="dashboard.js"></script>
</body>
</html>
2. Implement real-time charts with Chart.js:
const ctx = document.getElementById('trafficChart').getContext('2d');
const trafficChart = new Chart(ctx, {
type: 'line',
data: {
labels: [], // timestamps
datasets: [{
label: 'Packets/sec',
data: [],
borderColor: 'rgba(75, 192, 192, 1)',
fill: false
}]
},
options: { responsive: true }
});

function updateChart() {
fetch('/api/stats')
.then(response => response.json())
.then(data => {
trafficChart.data.labels.push(new Date().toLocaleTimeString());
trafficChart.data.datasets[bash].data.push(data.total_packets);
trafficChart.update();
});
}
setInterval(updateChart, 2000); // update every 2 seconds
3. Map attack sources with Leaflet:
const map = L.map('map').setView([20, 0], 2);
L.tileLayer('https://{s}.tile.openstreetmap.org/{z}/{x}/{y}.png').addTo(map);

function addAttackMarker(lat, lng, severity) {
const color = severity === 'high' ? 'red' : 'orange';
L.circleMarker([lat, lng], { radius: 10, color: color }).addTo(map)
.bindPopup(<code>Attack from ${lat}, ${lng}</code>);
}
4. Enable WebSocket for zero-delay alerts: Use Socket.IO to push alerts from the Flask backend to the dashboard instantly, eliminating the need for polling.
5. Deployment and Cloud Hardening
Deploying the system in a production environment requires containerization, secure configuration, and resilience against common cloud-based attacks.
Step‑by‑Step Guide:
1. Containerize with Docker:
FROM python:3.9-slim
WORKDIR /app
COPY requirements.txt .
RUN pip install -r requirements.txt
COPY . .
CMD ["python", "app.py"]
2. Deploy on cloud platforms like AWS, Azure, or Render.
3. Harden the API:
- Use environment variables for secrets (e.g.,
os.getenv('SECRET_KEY')). - Enable CORS only for trusted origins.
- Implement input validation and sanitization to prevent injection attacks.
- Use HTTPS with TLS 1.2+ to encrypt data in transit.
- Monitor system health: Integrate logging and alerting (e.g., ELK stack, Prometheus) to track API performance and detection accuracy.
6. Vulnerability Exploitation and Mitigation Testing
To validate the system, simulate common attack patterns and measure detection efficacy.
Simulation Commands:
- Port Scan (Linux): `nmap -sS -p 1-1000
`
– DDoS Simulation (using hping3): `sudo hping3 -S -p 80 –flood`
– SQL Injection Test: Use sqlmap or custom payloads in HTTP requests.
Mitigation Strategies:
- Rate Limiting: Implement at the API gateway to prevent brute-force and DoS attempts.
- IP Blocking: Automatically block source IPs that exceed anomaly thresholds for a defined period.
- Alert Escalation: Integrate with SIEM tools (e.g., Splunk, Elastic Security) for centralized incident response.
What Undercode Say:
- Key Takeaway 1: Proactive defense is no longer optional—AI-driven anomaly detection provides a critical early warning capability that reduces dwell time and minimizes breach impact. By shifting from reactive signatures to behavioral baselines, organizations can detect novel and zero-day threats.
- Key Takeaway 2: Integration of machine learning with real-time visualization creates a powerful synergy. Analysts can not only receive alerts but also visually correlate attack patterns, geolocate threat sources, and respond faster. The combination of Isolation Forest, Flask, and Chart.js offers a scalable, open-source blueprint for building a modern security operations center (SOC) dashboard.
Analysis: The project demonstrates a practical, end-to-end implementation of an AI-driven early warning system. While Isolation Forest is computationally efficient and handles high-dimensional data well, it requires careful tuning to minimize false positives—a challenge addressed through two-stage pipelines. The Flask API provides a flexible integration layer, but production deployments must incorporate authentication, logging, and rate limiting to prevent the monitoring system itself from becoming an attack vector. The dashboard, while visually compelling, should be optimized for low-latency updates using WebSockets rather than polling.
Prediction:
- +1 The adoption of AI-powered early warning systems will become a standard requirement for enterprise security frameworks within the next three years, driven by regulatory mandates and the increasing sophistication of automated attacks.
- +1 Open-source projects like this will accelerate innovation in the cybersecurity community, lowering the barrier to entry for organizations to build custom, transparent detection systems tailored to their specific network environments.
- -1 Adversaries will increasingly target the ML models themselves through adversarial attacks and data poisoning, necessitating robust model validation and continuous retraining pipelines to maintain detection integrity.
- -1 The complexity of integrating real-time packet capture, ML inference, and visualization may lead to operational overhead and false alert fatigue, requiring investments in skilled personnel and automated response orchestration to realize the full value of these systems.
▶️ Related Video (62% Match):
🎯Let’s Practice For Free:
🎓 Live Courses & Certifications:
Join Undercode Academy for Verified Certifications
🚀 Request a Custom Project:
Secure, high-velocity infrastructure and disruptive technological engineering. Contact our engineering team for high-tier development and proprietary systems:
[email protected]
💎 Smart Architecture | 🛡️ Secure by Design | ⭐ Trusted by Thousands
IT/Security Reporter URL:
Reported By: Anirudh Pratap – Hackers Feeds
Extra Hub: Undercode MoN
Basic Verification: Pass ✅


