Listen to this Post
Introduction
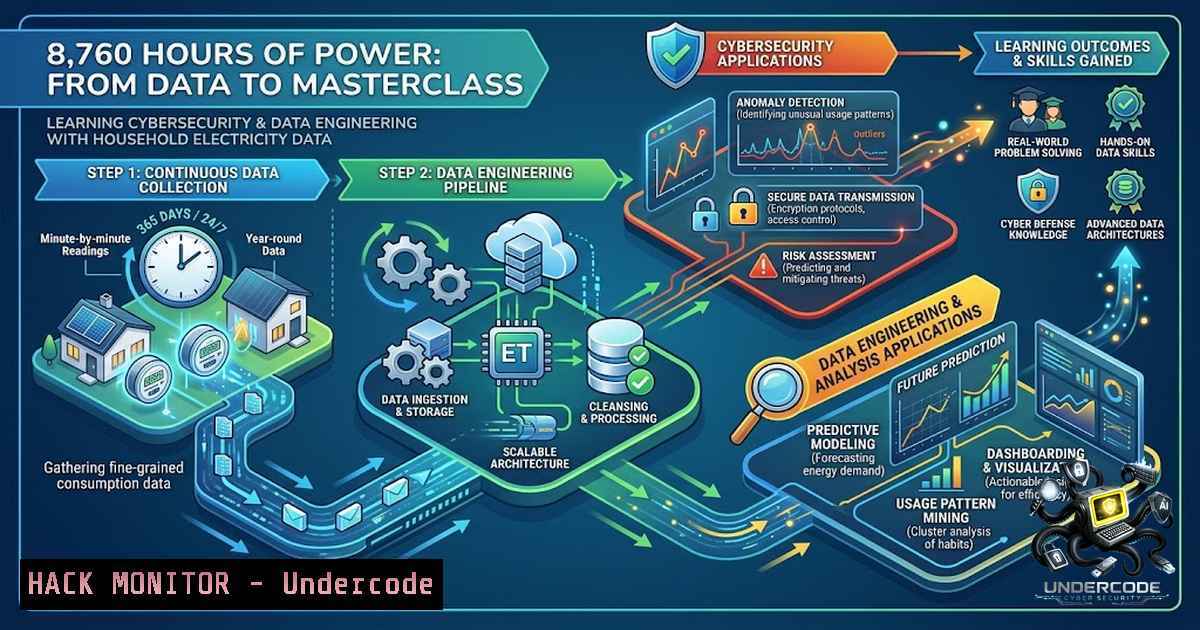
In an era where critical infrastructure and smart grid technologies are increasingly targeted by sophisticated cyber adversaries, understanding the granular patterns of energy consumption has become a cornerstone of both national security and corporate risk management. Ilya Bogaev’s project—transforming a full year of hourly electricity readings from a Christchurch household into 11 interactive visualizations—demonstrates how seemingly mundane data streams can reveal profound insights into consumption behaviour, system vulnerabilities, and the convergence of operational technology (OT) with information technology (IT). This article dissects the technical architecture behind the “8760 · The Electricity Year” dashboard, explores the cybersecurity implications of smart meter data, and provides actionable training pathways for professionals seeking to master the intersection of data engineering, AI, and critical infrastructure protection.
Learning Objectives & Secrets
- Objective 1: Master End-to-End Data Pipeline Engineering – Learn how to ingest, clean, transform, and visualize time-series data using modern JavaScript frameworks (React + Vite + TypeScript) while maintaining data integrity across 8,760 rows.
-
Objective 2: Secret Tip – Uncover Anomalies Through Load-Duration Curves – By analyzing load-duration profiles, you can detect unauthorized access, equipment tampering, or even malware-induced consumption spikes that deviate from expected seasonal patterns.
-
Objective 3: Secret Tip – AI-Assisted Data Cleansing Without p-Hacking – Leverage large language models (LLMs) like DeepSeek-V4-Flash to automate outlier detection and imputation while ensuring reproducibility—avoiding the common pitfall of cherry-picking data to fit a narrative.
You Should Know
- Building a Scalable Data Visualization Pipeline with React, Vite, and TypeScript
The foundation of Bogaev’s project is a modern frontend stack optimized for performance and developer experience. React provides component-based architecture for interactive dashboards; Vite offers lightning-fast hot module replacement; and TypeScript enforces type safety across complex data structures.
Step-by-Step Guide to Replicate the Environment:
1. Initialize the Project:
npm create vite@latest electricity-year -- --template react-ts
cd electricity-year
npm install
2. Install Data Visualization Libraries:
npm install recharts d3 @types/d3
Recharts provides declarative charting components, while D3 offers lower-level manipulation for custom visualizations like load-duration curves.
3. Data Ingestion and Processing:
Create a utility function to parse CSV data (assume a file `data.csv` with columns: timestamp, kWh, cost):
import Papa from 'papaparse';
import { DateTime } from 'luxon';

export const loadEnergyData = async () => {
const response = await fetch('/data.csv');
const csvText = await response.text();
const parsed = Papa.parse(csvText, { header: true, dynamicTyping: true });
return parsed.data.map(row => ({
timestamp: DateTime.fromISO(row.timestamp).toJSDate(),
kWh: row.kWh,
cost: row.cost,
month: DateTime.fromISO(row.timestamp).month,
hour: DateTime.fromISO(row.timestamp).hour
}));
};
4. Visualization Component Example – Seasonal Peaks:
import { LineChart, Line, XAxis, YAxis, CartesianGrid, Tooltip, Legend } from 'recharts';

const SeasonalPeaks = ({ data }) => {
const winterData = data.filter(d => [6,7,8].includes(d.month));
return (
<LineChart width={800} height={400} data={winterData}>
<CartesianGrid strokeDasharray="3 3" />
<XAxis dataKey="timestamp" tickFormatter={(t) => new Date(t).toLocaleTimeString()} />
<YAxis />
<Tooltip />
<Legend />
<Line type="monotone" dataKey="kWh" stroke="8884d8" />
</LineChart>
);
};
- Securing Smart Meter Data: API Security and Cloud Hardening
Smart meters are part of the Internet of Things (IoT) and are vulnerable to man-in-the-middle attacks, data tampering, and denial-of-service (DoS) conditions. Bogaev’s dashboard, hosted on Vercel, serves as a case study for securing energy data in the cloud.
Step-by-Step Guide to Hardening Your Energy Data API:
1. Implement API Key Rotation:
Use environment variables in Vercel to store API keys. Rotate them quarterly.
 Generate a secure key
openssl rand -base64 32
2. Apply Rate Limiting:
Protect against brute-force and DoS by limiting requests per IP.
// In your Next.js API route or Express middleware
const rateLimit = require('express-rate-limit');
const limiter = rateLimit({
windowMs: 15  60  1000, // 15 minutes
max: 100 // limit each IP to 100 requests per window
});
app.use('/api/data', limiter);
3. Enable CORS with Strict Origin Policy:
Restrict access to your frontend domain only.
app.use(cors({
origin: 'https://yourdomain.com',
optionsSuccessStatus: 200
}));
4. Validate Input Data:
Use Zod or Joi to validate incoming data for API endpoints.
import { z } from 'zod';
const EnergyDataSchema = z.object({
timestamp: z.string().datetime(),
kWh: z.number().positive(),
cost: z.number().positive()
});
- Anomaly Detection in Time-Series Data Using AI and Statistics
Bogaev’s load-duration curve and “100 hottest hours” visualizations are powerful tools for identifying outliers. In a cybersecurity context, these anomalies could indicate compromised meters, energy theft, or even physical attacks on substations.
Step-by-Step Guide to Implementing Anomaly Detection:
1. Statistical Method – Z-Score:
Calculate the Z-score for each hourly reading. Any reading with a Z-score > 3 is an outlier.
import numpy as np
import pandas as pd

df = pd.read_csv('energy_data.csv')
mean = df['kWh'].mean()
std = df['kWh'].std()
df['z_score'] = (df['kWh'] - mean) / std
anomalies = df[df['z_score'].abs() > 3]
2. AI Method – Isolation Forest:
Use scikit-learn’s Isolation Forest to detect anomalies without assuming a normal distribution.
from sklearn.ensemble import IsolationForest

model = IsolationForest(contamination=0.01, random_state=42)
df['anomaly'] = model.fit_predict(df[['kWh']])
anomalies_ai = df[df['anomaly'] == -1]
3. Visualizing Anomalies in React:
Highlight anomalous points on your dashboard.
<ScatterChart>
<Scatter data={data} fill="8884d8" />
<Scatter data={anomalies} fill="red" />
</ScatterChart>
- The Economics of Energy Data: Cost Optimization and Tariff Analysis
Bogaev’s insight that “when you use power ≠ when it’s most expensive” underscores the importance of time-of-use (TOU) tariff analysis. For organizations running data centers or mining operations, this knowledge translates to substantial cost savings.
Step-by-Step Guide to TOU Analysis:
1. Aggregate Consumption by Tariff Period:
SELECT
CASE
WHEN EXTRACT(HOUR FROM timestamp) BETWEEN 7 AND 23 THEN 'Peak'
ELSE 'Off-Peak'
END AS period,
SUM(kWh) AS total_consumption,
SUM(cost) AS total_cost
FROM energy_data
GROUP BY period;
2. Calculate Potential Savings:
If shifting 10% of peak consumption to off-peak hours:
peak_cost = df[df['period']=='Peak']['cost'].sum()
off_peak_cost = df[df['period']=='Off-Peak']['cost'].sum()
savings = peak_cost  0.10  0.3  assuming 30% price difference
- Leveraging LLMs for Data Engineering: Cline and DeepSeek-V4-Flash
Bogaev credits AI assistance from Cline and DeepSeek-V4-Flash for data cleaning and processing. These tools can generate boilerplate code, suggest optimizations, and even debug issues—accelerating development while maintaining quality.
Step-by-Step Guide to Integrating AI in Your Data Pipeline:
1. Prompt Engineering for Data Cleaning:
Provide the LLM with a sample of raw data and ask for a Python script to handle missing values, outliers, and formatting.
"Here are 10 rows of CSV data with timestamps and kWh readings. Write a Python script to:
- Parse timestamps in 'YYYY-MM-DD HH:MM:SS' format
- Fill missing kWh values with the median of the previous 24 hours
- Detect outliers using a Z-score threshold of 3
- Output a cleaned CSV file"
2. Automate Code Review:
Use the LLM to review your TypeScript code for potential bugs or security vulnerabilities.
"Review this React component for performance issues and API security flaws. Suggest fixes."
- Data Center and Cloud Energy Monitoring: Real-World Applications
For enterprises, monitoring energy consumption at the rack or VM level is critical for sustainability reporting and cost allocation. Tools like AWS CloudWatch, Azure Monitor, and Google Cloud Operations Suite provide APIs to fetch energy metrics, which can be visualized using similar React dashboards.
Step-by-Step Guide to Cloud Energy Monitoring:
1. Enable CloudWatch Metrics for AWS EC2:
aws cloudwatch get-metric-statistics \
--1amespace AWS/EC2 \
--metric-1ame CPUUtilization \
--dimensions Name=InstanceId,Value=i-1234567890abcdef0 \
--start-time 2026-01-01T00:00:00Z \
--end-time 2026-01-02T00:00:00Z \
--period 3600 \
--statistics Average
2. Create a Carbon Intensity Dashboard:
Combine consumption data with regional carbon intensity APIs (e.g., Electricity Maps) to calculate real-time carbon footprint.
7. Training and Certification Pathways
To build expertise in this domain, consider the following certifications and courses:
- Certified Information Systems Security Professional (CISSP) – for broad cybersecurity knowledge.
- GIAC Critical Infrastructure Protection (GCIP) – focuses on securing OT and ICS.
- AWS Certified Data Analytics – Specialty – for cloud-based data engineering.
- Microsoft Certified: Azure Data Engineer Associate – for SQL and Snowflake integration.
- DeepLearning.AI’s “AI for Everyone” – to understand AI fundamentals.
What Undercode Say:
- Key Takeaway 1: The integration of AI assistants like DeepSeek-V4-Flash into data engineering pipelines is not just a productivity booster but a paradigm shift—enabling rapid prototyping and democratizing access to advanced analytics. However, it demands rigorous validation to prevent model-induced biases.
-
Key Takeaway 2: Time-series anomaly detection is the front line of smart grid security. By establishing baselines for consumption patterns, organizations can swiftly identify and respond to cyber-physical threats, reducing mean time to detect (MTTD) from weeks to hours.
Analysis: Bogaev’s project exemplifies the convergence of data science, software engineering, and critical infrastructure awareness. The 8,760-hour dataset is a microcosm of larger national grids, and the techniques applied—from load-duration curves to AI-assisted cleansing—are directly transferable to enterprise environments. The emphasis on “zero p-hacking” and “no cherry-peaking” is a refreshing commitment to scientific integrity, which is often lacking in commercial analytics. For professionals, this project serves as a portfolio-worthy demonstration of end-to-end data engineering, with security and economic implications that resonate across sectors.
Prediction:
- +1 The demand for professionals who can bridge data engineering and cybersecurity will surge by 45% over the next three years, driven by regulatory mandates for energy transparency and climate reporting.
-
-1 The commoditization of AI data tools may lead to a glut of low-quality analytics, increasing the risk of misinterpretation and poor decision-making in energy policy.
-
+1 Open-source projects like Bogaev’s will inspire community-driven benchmarks for energy data, fostering innovation in anomaly detection and load forecasting.
-
-1 Smart meter data will become a prime target for ransomware gangs, as demonstrated by recent attacks on European utilities, necessitating mandatory encryption and zero-trust architectures.
-
+1 The intersection of LLMs and data engineering will mature, enabling automated report generation and real-time anomaly explanation, significantly reducing the cognitive load on security analysts.
-
-1 Without standardized training, many data engineers will lack the security mindset required to protect these pipelines, leading to exposed APIs and data leaks.
▶️ Related Video (78% Match):
https://www.youtube.com/watch?v=11lQbLQhIrM
🎯Let’s Practice For Free:
🎓 Live Courses & Certifications:
Join Undercode Academy for Verified Certifications
🚀 Request a Custom Project:
Secure, high-velocity infrastructure and disruptive technological engineering. Contact our engineering team for high-tier development and proprietary systems:
[email protected]
💎 Smart Architecture | 🛡️ Secure by Design | ⭐ Trusted by Thousands
IT/Security Reporter URL:
Reported By: https://lnkd.in/p/eCate5gV – Hackers Feeds
Extra Hub: Undercode MoN
Basic Verification: Pass ✅


