
Listen to this Post
Introduction
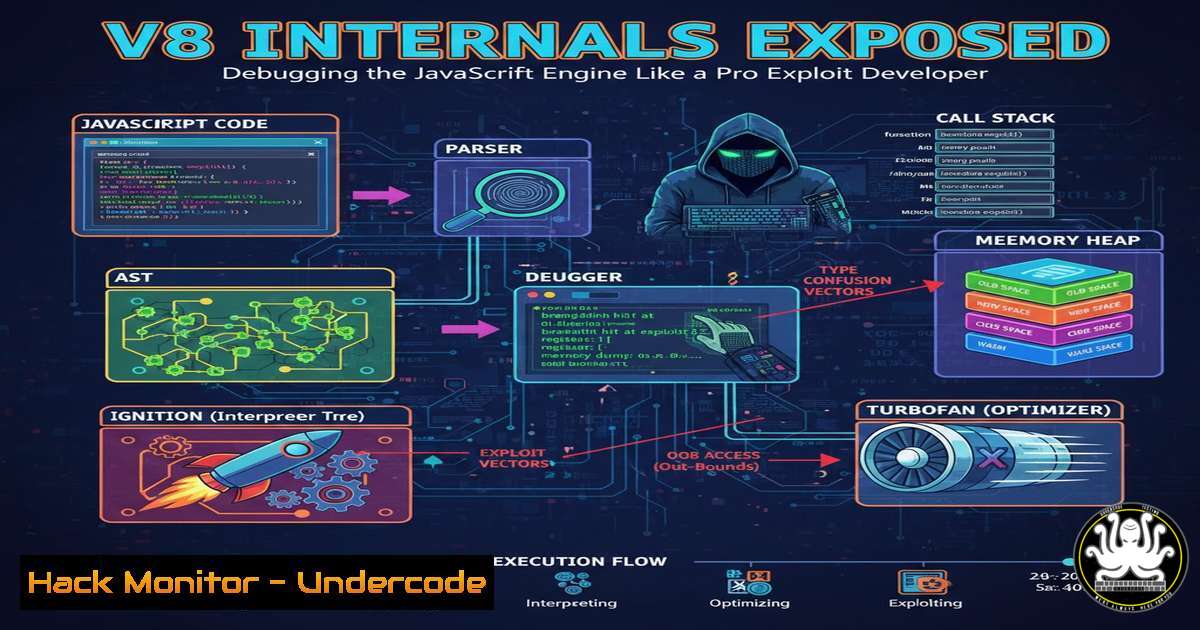
Modern browser exploitation hinges on understanding JavaScript engines, and V8 – Chrome’s high‑performance engine – is the prime target. Debugging V8 directly with D8, its standalone shell, removes browser‑layer complexity and allows researchers to isolate JIT compiler bugs, type confusions, and memory corruption primitives. This guide transforms the theoretical setup into a hands‑on, reproducible pipeline for both Linux and Windows environments.
Learning Objectives
- Build a debug‑ready D8 binary from the official V8 source tree with custom build arguments.
- Configure and attach debuggers (GDB, WinDbg) to D8 for live analysis of JIT‑compiled code.
- Apply instrumentation and trace flags to uncover vulnerability primitives and verify exploit reliability.
You Should Know
- Building V8 and D8 from Source – The Debug Foundation
A stock release build strips critical symbols and disables assertions. For exploit research we need full debugging capability.
Linux (Ubuntu/Debian)
 Install depot_tools
git clone https://chromium.googlesource.com/chromium/tools/depot_tools.git
export PATH="$PWD/depot_tools:$PATH"

Fetch V8
fetch v8
cd v8

Check out a specific branch (e.g., the latest stable)
git checkout branch-heads/12.0  Adjust as needed

Generate debug build configuration
gn gen out/x64.debug --args='is_debug=true symbol_level=2 v8_enable_slow_dchecks=true v8_optimized_debug=false'

Build D8
ninja -C out/x64.debug d8
Windows (PowerShell)
 Same depot_tools, but with autoninja
git clone https://chromium.googlesource.com/chromium/tools/depot_tools.git
$env:Path = "C:\depot_tools;$env:Path"
fetch v8
cd v8
gn gen out/x64.debug --args="is_debug=true symbol_level=2 v8_enable_slow_dchecks=true v8_optimized_debug=false is_clang=true"
autoninja -C out/x64.debug d8
What this does:
`is_debug=true` disables optimizations and preserves frame pointers. `symbol_level=2` embeds full debug symbols. `v8_optimized_debug=false` keeps generated code readable. The output `d8` binary contains all assertions and detailed logging hooks.
2. D8 Command‑Line Switches Every Researcher Should Know
D8 accepts numerous V8 flags that expose internal behaviour. These are your primary instrumentation toolkit.
| Flag | Purpose |
|||
| `–trace-turbo` | Logs TurboFan JIT compilation phases to JSON (viewable in Chrome chrome://tracing). |
| `–trace-opt` | Prints when functions are optimized/deoptimized. |
| `–allow-natives-syntax` | Enables %DebugPrint, `%OptimizeFunctionOnNextCall` – essential for crafting test cases. |
| `–print-opt-code` | Dumps the generated machine code of optimized functions. |
| `–verify-heap` | Runs extensive heap integrity checks after each GC (very slow, great for fuzzing). |
Example invocation:
./d8 --allow-natives-syntax --trace-opt --print-opt-code test.js
- Attaching a Debugger and Breaking on JIT‑ed Code
Debugging JIT‑generated code requires special care because the code is dynamically created and not known at compile time.
Linux – GDB with V8 helper scripts
V8 provides a Python GDB extension:
gdb -q out/x64.debug/d8
(gdb) source tools/gdbinit
(gdb) break v8::internal::__triggered_by_test_  Custom breakpoint
(gdb) run --allow-natives-syntax test.js
Now you can inspect JavaScript objects with the `job` command, examine the call stack, and see inlined functions.
Windows – WinDbg
Load the `d8.exe` binary and set breakpoints on V8 runtime functions:
bp v8!v8::internal::Runtime_CompileLazy
Combine with the `!jsstack` extension (from V8’s tools/windbg.js) to view JavaScript stack frames.
4. Instrumenting D8 for Vulnerability Analysis
Beyond passive debugging, active instrumentation reveals subtle type confusions and out‑of‑bounds accesses.
Sanitizers:
- ASan (AddressSanitizer): `gn args out/x64.asan –args=’is_debug=false sanitize=”address” v8_enable_slow_dchecks=true’`
– UBSan (UndefinedBehaviorSanitizer): add `sanitize=”undefined”`
Custom logging:
Insert temporary `printf` statements in V8 source (e.g., in `src/compiler/` or src/objects/) to trace object layouts. Recompile with ninja -C out/x64.debug d8.
Heap snapshot comparison:
./d8 --allow-natives-syntax --snapshot-blob=snapshot_blob.bin test.js
Take snapshots before/after a suspected action and diff them with v8/tools/consarray.js.
5. Reproducing and Triaging Real‑World V8 Bugs
Take a recent public V8 issue (e.g., CVE‑2023‑4069, a JIT bug in Turbofan). Build the vulnerable revision and the patched revision side by side.
Steps:
1. Check out the commit before the fix:
git checkout <vulnerable-hash>
gn gen out/x64.vuln --args='is_debug=true v8_enable_slow_dchecks=false'
ninja -C out/x64.vuln d8
2. Run the Proof‑of‑Concept:
./out/x64.vuln/d8 --allow-natives-syntax --trace-turbo poc.js
3. Observe the crash and collect register state, disassembly.
4. Repeat with the patched version to confirm the fix.
This workflow is identical to how zero‑day researchers verify a bypass.
6. Cross‑Platform Debugging: Windows Considerations
While most V8 research occurs on Linux, Windows targets (Edge, Electron) are equally important.
- Use Visual Studio 2022 to open the V8 solution (
v8\v8.sln) after runninggn gen out\x64.debug --ide=vs2022. - Attach to a running `d8.exe` process via Debug > Attach to Process.
- For low‑level memory inspection, WinDbg remains superior. Load the public Microsoft symbol server and V8’s private symbols generated during the build.
Command reminder for WinDbg:
.symfix
.sympath+ C:\v8\out\x64.debug
.reload
bp d8!v8::internal::Isolate::Throw
g
7. From D8 to Full Browser Exploitation
D8 serves as a harness, but the final exploit runs inside Chrome’s sandbox. To bridge the gap:
- Use the same V8 build as your Chromium checkout.
- Debug the browser with `–single-process` and `–no-sandbox` initially.
- Transfer your D8‑proven primitive to the browser renderer using the same V8 runtime functions.
- Employ MojoJS or WebAssembly to escalate from a V8 memory corruption to a full sandbox escape.
Example: Turning an OOB access in D8 into an arbitrary read/write in Chrome requires careful manipulation of ArrayBuffer backing stores – exactly what you would first test in D8.
What Undercode Say
Key Takeaway 1:
Mastering D8 debugging is the shortest path to understanding V8’s JIT internals. The ability to rebuild the engine with custom flags, attach a debugger to dynamically generated code, and instrument execution flow gives researchers the same low‑level visibility as V8 committers.
Key Takeaway 2:
The environment is as important as the exploit. A reproducible build pipeline with debug symbols, sanitizers, and trace flags eliminates “works on my machine” pitfalls and lets the community verify and build upon your findings.
Analysis:
The shift towards more complex JIT vulnerabilities (Spectre‑variant, side‑channel, and pipeline‑stall attacks) demands precise tooling. D8, when correctly instrumented, exposes microarchitectural side effects that full browsers obscure. We are seeing a renaissance in V8 fuzzing where custom‑built D8 harnesses outperform generic browser fuzzers. Researchers who invest time in this setup gain an asymmetric advantage: they can reproduce and bypass patches within hours of a disclosure. Moreover, the skills transfer directly to other JS engines (JavaScriptCore, SpiderMonkey), as the debugging philosophies are identical. The barrier to entry is lowering thanks to scripts like `v8/tools/` and the growing ecosystem of V8‑specific GDB/LLDB extensions. Yet, the need for low‑level systems knowledge (assembly, memory management, compilation pipelines) remains the true filter. This guide is not just about commands; it’s a mindset: treat the engine as a malleable piece of software, not a black box.
Prediction
As V8 continues to integrate WebAssembly GC and Sandboxing (e.g., the V8 Sandbox), D8 will become the primary testbed for novel cross‑isolation attacks. Future debugging articles will focus on corrupting sandboxed memory regions from within D8, modeling how a renderer compromise can bypass the new in‑process sandbox. The tools described here – symbol‑level debugging, custom builds, and instrumentation – will remain essential, but the targets will shift from raw type confusions to logical vulnerabilities in the sandbox boundary. Researchers fluent in D8 debugging will be the first to weaponize these new classes of bugs.
▶️ Related Video (84% Match):
🎯Let’s Practice For Free:
IT/Security Reporter URL:
Reported By: Https: – Hackers Feeds
Extra Hub: Undercode MoN
Basic Verification: Pass ✅


