Listen to this Post
Introduction:
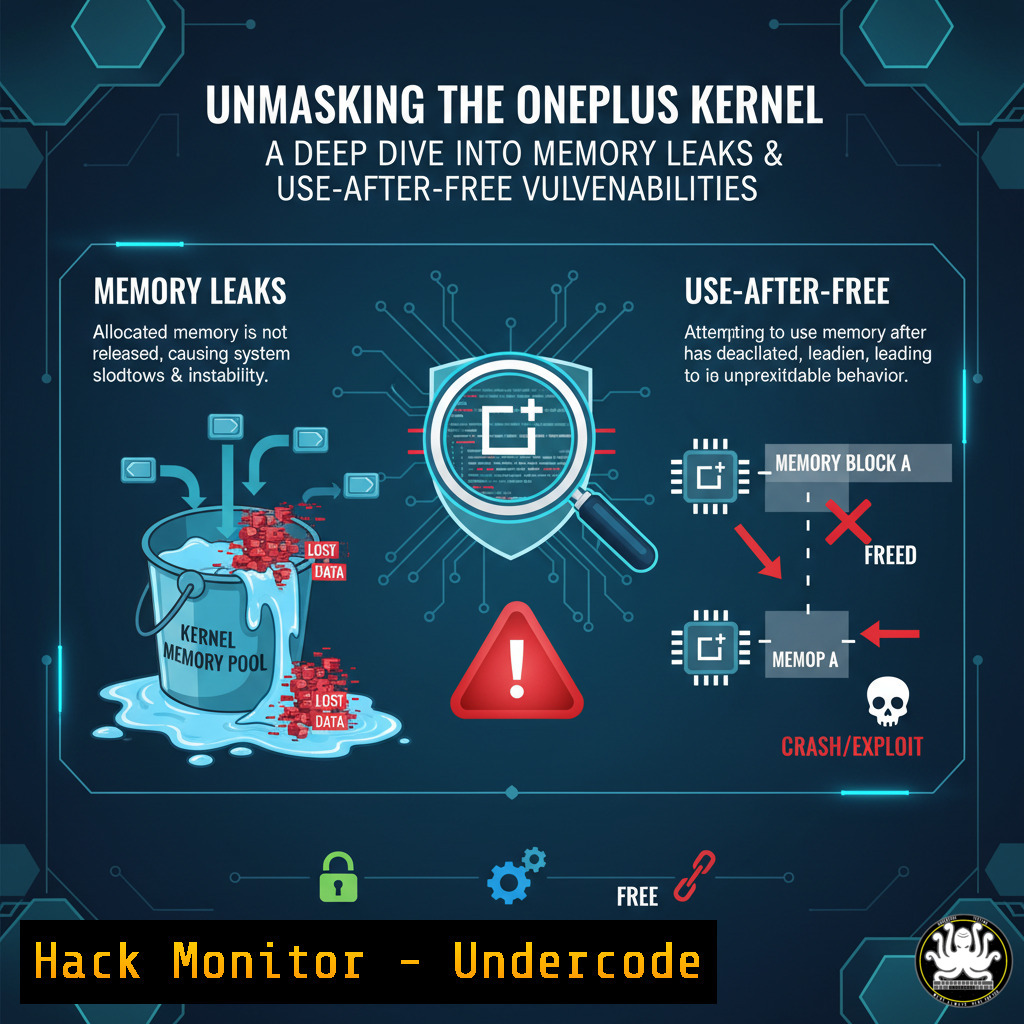
A recent exploration into the kernel source code of a OnePlus device has uncovered critical memory safety vulnerabilities, specifically a memory leak and a potential use-after-free (UAF) flaw. These vulnerabilities, residing at the heart of the device’s operating system, can lead to denial-of-service (DoS) attacks and potentially serve as a gateway for arbitrary code execution, compromising the entire device.
Learning Objectives:
- Understand the fundamental concepts of memory leaks and use-after-free vulnerabilities within the Linux kernel.
- Learn how to analyze kernel source code to identify potential memory safety issues.
- Acquire practical skills for writing a proof-of-concept (PoC) exploit to demonstrate a denial-of-service condition.
You Should Know:
1. Identifying a Kernel Memory Leak
A memory leak occurs when a program allocates memory but fails to release it back to the system, gradually consuming available resources. In the kernel, this can lead to system instability and crashes.
Command/Tutorial: Using `kmemleak` for Dynamic Detection
The Linux kernel has a built-in feature called `kmemleak` which scans the memory for unreferenced objects. To use it, you must enable it in your kernel configuration and mount the debug filesystem.
 Mount debugfs if not already mounted
sudo mount -t debugfs nodev /sys/kernel/debug

Trigger a kernel memory leak scan
echo scan > /sys/kernel/debug/kmemleak

Check the report for potential leaks
cat /sys/kernel/debug/kmemleak
Step-by-Step Guide:
1. Ensure your kernel is compiled with `CONFIG_DEBUG_KMEMLEAK=y`.
2. Mount the `debugfs` filesystem to `/sys/kernel/debug`.
- Execute the `echo scan` command to initiate a scan of the kernel memory.
- Read the output of the `cat` command. `kmemleak` will report the address, size, and stack trace of any suspected memory leaks it finds, which is the first step in validating a researcher’s findings.
2. Triggering a Use-After-Free Condition
A use-after-free vulnerability happens when a program continues to use a pointer after it has freed the memory it points to. This can corrupt data or allow an attacker to execute arbitrary code.
Code Snippet: Conceptual UAF in a Kernel Module
The following is a simplified, conceptual representation of the code pattern that could lead to a UAF.
// Kernel Code (Hypothetical flawed example)
struct kernel_object obj;

obj = kmalloc(sizeof(obj), GFP_KERNEL);
// ... use the object ...
kfree(obj); // Memory is freed
// ... later, without re-allocation ...
obj->data = value; // UAF: Writing to freed memory!
Step-by-Step Guide:
- The kernel allocates memory for `obj` using
kmalloc. - The code uses the object for its intended purpose.
3. The memory is correctly freed with `kfree(obj)`.
- The critical flaw occurs when the code, due to a complex or erroneous execution path, accesses `obj` again after it has been freed. This access, whether a read or write, is undefined behavior and is the core of the UAF vulnerability.
3. Crafting a Denial-of-Service Proof-of-Concept
A Denial-of-Service (DoS) PoC demonstrates the immediate impact of a vulnerability by making a system or service unavailable.
Command/Code: Basic Kernel Panic Trigger
While a full UAF exploit for code execution is complex, a simple DoS can often be triggered by causing a kernel panic. The `sysrq` trigger is a well-known method.
 WARNING: This command will immediately crash the system.
echo c > /proc/sysrq-trigger
Step-by-Step Guide:
- The researcher’s PoC for the OnePlus kernel bug would operate on a similar principle: forcing the kernel into an unrecoverable state.
- By meticulously manipulating the UAF vulnerability—for instance, by causing the kernel to access a freed and potentially corrupted object—the PoC triggers a kernel oops or panic.
- This is demonstrated by the device freezing, restarting, or becoming completely unresponsive, proving the vulnerability’s real-world impact without requiring full code execution.
4. Static Analysis with `checkpatch.pl`
Before diving into dynamic testing, static analysis tools can catch common code style and potential error patterns in the kernel source.
Command/Tutorial:
The Linux kernel source tree includes a script called `checkpatch.pl` which checks code against kernel coding standards and can identify some common pitfalls.
 Run from the root of the Linux kernel source tree
./scripts/checkpatch.pl -f --no-tree drivers/mydriver/mydriver.c
Step-by-Step Guide:
- Navigate to the root directory of your kernel source code.
- Run the `checkpatch.pl` script on the source file you are reviewing or developing.
- The script will output warnings and errors related to coding style, and sometimes potential logical errors. While not a substitute for deep code review, it is an essential first-pass filter for code quality.
5. Analyzing Kernel Oops Messages
When the kernel encounters a fatal error, it prints an “oops” message. Understanding this output is crucial for debugging kernel vulnerabilities.
Command/Tutorial: Using `dmesg`
The kernel ring buffer, accessed via dmesg, contains these critical error messages.
 View the last kernel messages, focusing on the error
dmesg | tail -50

Or, for a continuously updating view of new messages
dmesg -w
Step-by-Step Guide:
- After a suspected kernel crash or error, the first step is to retrieve the log.
- Execute `dmesg | tail -50` to see the most recent 50 lines of kernel messages.
- Look for lines containing the word “BUG”, “Oops”, “general protection fault”, or a call trace (a stack dump). This information reveals the instruction that caused the fault and the sequence of function calls that led to it, which is invaluable for pinpointing the root cause of a UAF.
6. Using `gdb` with Kernel Core Dumps
For post-mortem analysis of a kernel crash, you can use a debugger like `gdb` on a kernel core dump.
Command/Tutorial: Basic `gdb` Commands for Kernel Dumps
 Load the kernel image and the core dump file into gdb
gdb /path/to/your/vmlinux /path/to/your/coredump.elf

Inside gdb, list the backtrace
(gdb) list
(gdb) bt
Step-by-Step Guide:
- Obtain the `vmlinux` kernel image (with debug symbols) and the core dump file from the crashed system.
- Launch
gdb, specifying both the `vmlinux` image and the core dump file. - Use the `bt` (backtrace) command to print the stack trace from the moment of the crash. This provides a detailed view of the kernel’s state, showing exactly which functions were active and with what parameters, allowing a researcher to trace the execution path that led to the UAF.
-
Hardening Against UAF: The Kernel Address Sanitizer (KASAN)
KASAN is a dynamic memory error detector designed to find use-after-free and out-of-bounds bugs.
Command/Tutorial: Enabling KASAN
KASAN must be enabled in the kernel configuration and requires a kernel recompilation.
 In your kernel config, ensure these are set
CONFIG_KASAN=y
CONFIG_KASAN_GENERIC=y
CONFIG_KASAN_OUTLINE=y  or CONFIG_KASAN_INLINE=y for faster, but larger binary
Step-by-Step Guide:
- During kernel configuration (e.g.,
make menuconfig), navigate to “Kernel hacking” -> “Memory Debugging” -> “KASan: runtime memory debugger”. - Enable KASAN and choose the reporting mode (outline is recommended for slower systems).
- Recompile and boot the new kernel. KASAN will now actively monitor memory allocations and accesses. If it detects a use-after-free bug, it will immediately report the error, the stack trace of the allocation, freeing, and invalid use, making it an invaluable tool for both developers and security researchers to catch such bugs early.
What Undercode Say:
- The discovery of a UAF vulnerability in a commercial smartphone kernel underscores the persistent challenge of memory safety in critical system software, even in products from major manufacturers.
- This finding highlights the critical importance of proactive security research, where individuals can uncover flaws that automated scanning might miss, ultimately leading to more robust consumer devices.
The discovery by the IoT security researcher is a classic example of the value of manual, deep-dive source code auditing. While fuzzing and automated tools are essential, they can miss complex logical flaws like specific race conditions or intricate UAF scenarios that require a human understanding of code flow. The fact that this vulnerability was found in a consumer device kernel is significant; it acts as a stark reminder that the attack surface for modern users extends deep into the core of their devices’ operating systems. For manufacturers, this incident reinforces the need to invest heavily in robust code review processes, integrate advanced sanitizers like KASAN into their development and QA pipelines, and foster a transparent and responsive relationship with the security research community to promptly address such disclosures.
Prediction:
The public disclosure of this kernel-level vulnerability will likely prompt other security researchers to scrutinize the codebases of various Android OEM kernels, leading to a short-term surge in similar findings. In the longer term, this will pressure manufacturers to adopt memory-safe languages like Rust for new kernel components and strengthen their software supply chain security. Failure to do so will leave millions of devices perpetually vulnerable to sophisticated threats that can achieve permanent device compromise, moving beyond temporary DoS to full, persistent rootkit installation.
🎯Let’s Practice For Free:
IT/Security Reporter URL:
Reported By: Ajay B – Hackers Feeds
Extra Hub: Undercode MoN
Basic Verification: Pass ✅


