Listen to this Post
Introduction:
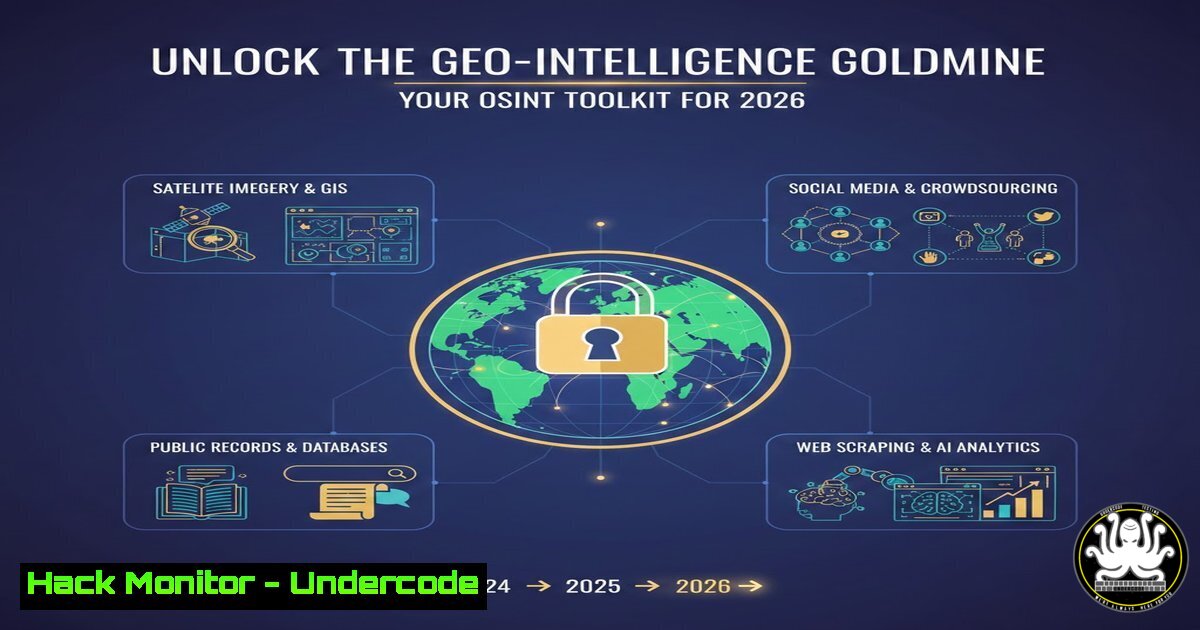
In the ever-evolving landscape of Open-Source Intelligence (OSINT), geospatial data has become the crown jewel for cybersecurity professionals and threat analysts. By leveraging free, browser-based Geographic Information System (GIS) tools, analysts can verify incident locations, track threat actor movements, and map critical infrastructure vulnerabilities without leaving their desks. This guide explores a comprehensive repository of digital mapping utilities, transforming raw geographical data into actionable cyber intelligence.
Learning Objectives:
- Understand how to utilize free GIS tools for cyber threat intelligence and incident verification.
- Learn to extract, convert, and visualize geospatial data for security investigations.
- Master command-line techniques to integrate geodata processing into automated security workflows.
- Identify open-source resources for mapping physical security perimeters and network infrastructure.
You Should Know:
1. Getting Started with QuickMapTools and Core Converters
The cornerstone of modern GEOINT (Geospatial Intelligence) is the ability to transform data between formats. QuickMapTools provides a suite of online converters that are essential for any OSINT investigator. Whether you are dealing with legacy data from a compromised device or exporting coordinates from a threat report, converting between formats like Shapefiles, GeoJSON, KML (Keyhole Markup Language), and CSV is the first step toward visualization.
Step‑by‑step guide: Converting a CSV of IP Geolocations to KML for Google Earth
1. Gather Data: Suppose you have a list of suspicious IP addresses. Use a command-line tool like `geoiplookup` or an API to get latitude and longitude.
Linux Command:
 Extract coordinates for a list of IPs (install geoip-bin first)
cat suspicious_ips.txt | while read ip; do geoiplookup $ip | grep "Country" ; done
2. Format the CSV: Create a CSV file (locations.csv) with the headers: Name,Latitude,Longitude.
Suspicious_Server_01,40.7128,-74.0060
C2_Endpoint_02,51.5074,-0.1278
3. Access the Tool: Navigate to the QuickMapTools link provided in the post (lnkd.in/gwR9bM6Y). Look for the “Converters” section and select “CSV to KML”.
4. Upload and Convert: Upload your `locations.csv` file. Ensure the latitude and longitude columns are correctly mapped.
5. Download and Visualize: Download the resulting `.kml` file and open it in Google Earth Pro to overlay the hostile infrastructure on a satellite map, allowing you to assess geographical proximity to potential targets.
2. Utilizing Downloaders for High-Resolution Satellite Imagery
To assess the physical security of a target site (e.g., a data center or a government building), you need recent, high-resolution imagery. The “Downloaders” category within GIS tools allows you to pull data directly from sources like Sentinel Hub or Landsat.
Step‑by‑step guide: Downloading recent imagery of a critical infrastructure site
1. Identify Coordinates: Use a tool like `latlong.net` or the Google Maps URL to get the exact decimal degrees of your target perimeter.
2. Access a Downloader: Within the GIS toolset, find a downloader linked to a satellite API (e.g., “Sentinel Downloader”).
3. Set Parameters:
AOI (Area of Interest): Draw a bounding box around your target.
Date Range: Select a date range relevant to your investigation (e.g., the week a specific alert was triggered).
Cloud Cover: Set cloud cover to less than 10%.
4. Download and Analyze: Download the GeoTIFF file. You can now analyze this image for physical changes, new construction (like Faraday cages), or unexpected vehicle presence that might correlate with a cyber-physical attack.
3. Measurement Tools for Threat Vector Analysis
Understanding distances is crucial in cybersecurity, especially when dealing with wireless network audits or assessing the range of a potential blast radius from a physical explosion. The “Measurements tools” allow for precise geodetic calculations.
Step‑by‑step guide: Calculating the effective range of a rogue Wi-Fi antenna
1. Locate the Source: Using wardriving data (e.g., from a Wigle.net export), pinpoint the suspected location of a rogue access point.
2. Use the Ruler Tool: In the GIS tool, select the “Measure Distance” function.
3. Draw the Radius:
Click on the pinpointed location of the rogue AP.
Drag the line outward to the perimeter of a nearby building or public space.
The tool will display the distance in meters.
4. Correlate with Attack Surface: If the distance is less than 100 meters and the rogue AP is using a high-gain antenna, it confirms the viability of a “Man-in-the-Middle” attack from a public parking lot. Document this measurement for your penetration testing report.
4. Visualizers and Heatmap Generators for Anomaly Detection
Visualizers help in identifying patterns that are invisible in raw log data. By plotting failed login attempts or DDoS attack origins on a heatmap, security analysts can quickly discern if an attack is coming from a broad, global botnet or a specific, concentrated geographic region.
Step‑by‑step guide: Creating a heatmap of attack origins from server logs
1. Extract IPs from Logs: Use a Linux one-liner to extract unique IPs from your `auth.log` or Apache access log.
 Extract IPs, count them, and sort
sudo cat /var/log/apache2/access.log | awk '{print $1}' | sort | uniq -c | sort -nr > attack_ips.txt
2. Geolocate the IPs: Use a script to enrich these IPs with latitude and longitude.
Windows PowerShell (using a REST API):
Get-Content .\attack_ips.txt | ForEach-Object {
$ip = $_ -split ' ' | Select-Object -Last 1
$response = Invoke-RestMethod -Uri "http://ip-api.com/json/$ip"
[bash]@{
IP = $ip
Lat = $response.lat
Lon = $response.lon
Count = $_ -split ' ' | Select-Object -First 1
}
} | Export-Csv -Path geolocated_attacks.csv -NoTypeInformation
3. Import to Visualizer: Upload this CSV to a “Heatmap Generator” tool within the GIS suite.
4. Analyze: The resulting heatmap will visually “glow” brighter over regions with the highest concentration of attack traffic, providing a clear visual for executive briefings on threat sources.
5. Generators for Synthetic Exercise Data
When training blue teams or developing red team simulations, synthetic geospatial data is required. The “Generators” section can create random, realistic data sets for tabletop exercises without compromising real operational security (OPSEC).
Step‑by‑step guide: Generating a fictional convoy route for a red team exercise
1. Select Generator: Find a “Random Path Generator” or “Synthetic Movement Generator.”
2. Define Constraints:
Start Point: Your company’s headquarters.
End Point: A critical off-site data center.
Waypoints: Add a few random stops.
Speed Variance: Set parameters for “realistic” stopping and starting.
3. Export KML: Generate and export the route as a KML file.
4. Deploy to Team: Distribute this KML to the red team. Their objective is to find “vulnerabilities” along the route—such as unsecured Wi-Fi at the waypoint coffee shops—effectively blending cyber and physical security testing.
What Undercode Say:
- Key Takeaway 1: Free GIS tools have democratized advanced GEOINT, allowing individual researchers to perform analyses that once required expensive government-grade software.
- Key Takeaway 2: The integration of command-line data processing (Linux/Windows) with browser-based visualization tools creates a powerful, end-to-end OSINT pipeline that is both efficient and repeatable.
- Key Takeaway 3: In 2026, the fusion of AI with these mapping tools will automate the detection of anomalous geographic patterns, flagging potential supply chain attacks or insider threats by correlating user travel data with network access logs.
Prediction:
As satellite constellations increase their revisit rates and resolution, we predict a surge in “Geo-Spoofing” attacks. Threat actors will begin to inject false geolocation data into public APIs to mislead OSINT analysts. Consequently, the next frontier in cybersecurity training will focus heavily on verifying the cryptographic integrity of geospatial metadata before trusting it for critical infrastructure protection decisions.
▶️ Related Video (90% Match):
🎯Let’s Practice For Free:
IT/Security Reporter URL:
Reported By: Https: – Hackers Feeds
Extra Hub: Undercode MoN
Basic Verification: Pass ✅


