Listen to this Post
Introduction:
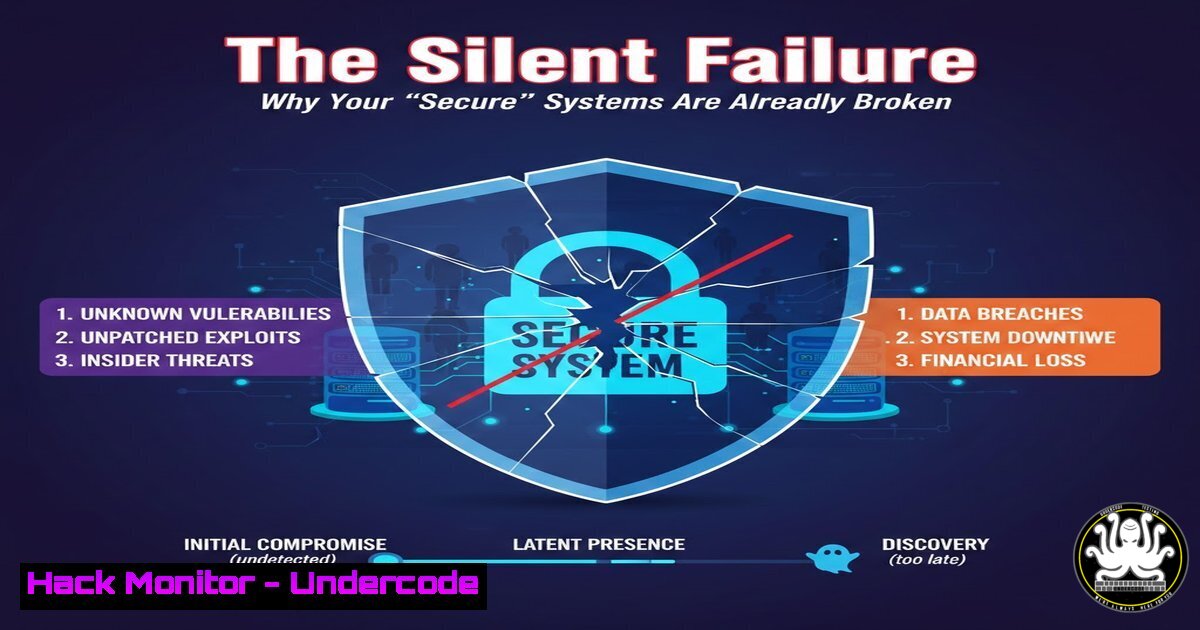
The traditional cybersecurity mantra, the CIA triad (Confidentiality, Integrity, Availability), serves as a fundamental blueprint for securing data and systems. However, security professionals operating in live, production environments are discovering a harsh reality: a system can be fully “secure” yet fundamentally broken. The most significant risks to an organization are no longer just sophisticated external attackers but the silent, creeping failures within our own infrastructure. When logging pipelines break, detection logic decays, or Machine Learning (ML) models drift, the system fails silently, costing organizations money, eroding trust, and creating liabilities far greater than a preventable breach.
Learning Objectives:
- Identify the critical intersection where Security Engineering meets Reliability Engineering (SRE).
- Learn to validate the integrity of security data pipelines to prevent silent failures.
- Understand how to implement stress tests and chaos engineering principles for security tooling.
- Develop strategies to monitor and maintain the health of detection logic and automation.
You Should Know:
1. Auditing the Integrity of Your Logging Pipeline
The foundation of any Security Operations Center (SOC) is its logging pipeline. If logs are dropped, delayed, or corrupted, your detection capabilities are blind. Security Engineers often assume data flows perfectly, but network congestion, misconfigured agents, or disk latency can cause failures that don’t trigger alerts.
Step‑by‑step guide to validating log flow:
To ensure your logs are actually reaching the Security Information and Event Management (SIEM) system, you must validate the pipeline from endpoint to aggregator.
Linux/MacOS (Verifying Agent Health and Connectivity):
 Check if your log forwarding agent (e.g., Filebeat, rsyslog) is running and check its status
systemctl status filebeat
 Or for rsyslog
systemctl status rsyslog

Manually generate a test log entry and verify it traverses the network
logger -p user.info "Test log message from $(hostname) at $(date)"
 Then, on the receiving server (SIEM), tail the incoming logs
tail -f /var/log/syslog | grep "Test log message"
Windows (PowerShell – Testing Event Log Forwarding):
 Check the status of the Windows Event Forwarding (WEF) service
Get-Service -Name Wecsvc

Generate a custom test event in the Application log
Write-EventLog -LogName Application -Source "SecurityTest" -EventId 9999 -Message "Test pipeline message from $env:COMPUTERNAME"

Use netcat (if installed) to test raw TCP connectivity to your SIEM ingest port
Test-NetConnection -ComputerName your-siem-server.com -Port 9999
This process reveals whether the “secure” system is actually feeding the data required to detect threats.
2. Detecting Drift in Security ML Models
Security infrastructure increasingly relies on ML for User and Entity Behavior Analytics (UEBA) or phishing detection. Model drift occurs when the statistical properties of the input data change, causing the model’s predictions to become less accurate over time. The system remains “secure” on paper, but misses anomalies or flags benign behavior.
Step‑by‑step guide to monitoring model health:
If you have access to a model’s prediction logs, you can monitor the distribution of scores.
Python Script Snippet (Using `scipy` and `numpy`):
import numpy as np
from scipy.stats import ks_2samp

Load baseline scores from training/validation
baseline_scores = np.load('baseline_prediction_scores.npy')

Load recent production scores (e.g., last 24 hours)
production_scores = np.load('production_scores_today.npy')

Perform Kolmogorov-Smirnov test to check if distributions are the same
ks_statistic, p_value = ks_2samp(baseline_scores, production_scores)

Define a threshold (e.g., p-value < 0.05 indicates significant drift)
if p_value < 0.05:
print(f"ALERT: Significant model drift detected (p-value: {p_value})")
else:
print(f"Model distribution stable (p-value: {p_value})")
Integrate this script into a CI/CD pipeline or cron job to alert the team when the ML behavior starts failing silently.
3. Stress-Testing Detection Logic with Chaos Engineering
You cannot trust a detection rule until you have proven it triggers under load. A rule might work perfectly in a lab environment but fail when the logging pipeline is saturated during a DDoS attack or a high-traffic business event.
Step‑by‑step guide to chaos testing for security:
Introduce controlled failure and load to see if your detection breaks.
Linux Command to Simulate High Throughput (using `stress`):
 Generate high I/O and CPU load to stress the logging agent's performance
sudo stress --cpu 4 --io 3 --vm 2 --vm-bytes 512M --timeout 120s

While the system is under load, generate a high volume of test logs rapidly
for i in {1..10000}; do logger "CHAOS_TEST: High volume test log $i"; done

Monitor the queue size of your log forwarder to see if it backs up
curl http://localhost:9600/stats | jq '.queues'
If the detection rule fails to fire because the logs were queued and delayed past the correlation window, you have identified a critical reliability gap.
4. Validating the “Health” of API Integrations
Modern security stacks rely on APIs (e.g., ticketing systems, threat intel feeds, SOAR playbooks). A common silent failure is an API key expiring or an integration endpoint changing, causing automation to fail without a clear alert.
Step‑by‑step guide to automated API health checks:
Create a simple synthetic transaction to test the integration.
Bash Script using cURL:
!/bin/bash
 Test a Threat Intelligence Feed API key and endpoint

API_KEY="your_api_key_here"
ENDPOINT="https://api.threatintel.com/v1/health"
EXPECTED_RESPONSE="OK"

Perform the check
RESPONSE=$(curl -s -w "%{http_code}" -H "Authorization: Bearer $API_KEY" $ENDPOINT)
HTTP_CODE="${RESPONSE: -3}"
BODY="${RESPONSE%???}"

Validate
if [[ "$HTTP_CODE" -ne 200 ]] || [[ "$BODY" != "$EXPECTED_RESPONSE" ]]; then
echo "Integration Failure: HTTP $HTTP_CODE - $BODY"
 Trigger alert via email or Slack webhook
curl -X POST -H 'Content-type: application/json' --data '{"text":"ALERT: Threat Intel API Integration Broken!"}' https://hooks.slack.com/services/YOUR/WEBHOOK
exit 1
else
echo "Integration Healthy"
fi
Schedule this script to run every 5 minutes via a cron job or a Kubernetes CronJob to catch failures instantly.
5. Auditing Automation Logic (SOAR Playbooks)
Automation can accelerate attacks if it fails. A SOAR playbook that automatically quarantines endpoints might fail because a new Active Directory schema changed a field name, or the SSH credentials for the firewall rotated. The automation runs (executes successfully) but takes no effective action.
Step‑by‑step guide to auditing playbooks:
Implement “idempotency checks” and validation steps within the playbook code.
Pseudocode / Python Logic for Post-Action Validation:
def quarantine_endpoint(hostname):
 Step 1: Execute quarantine command via API
api_response = firewall_api.block_host(hostname)

Step 2: Verify the action was effective
time.sleep(5)  Wait for rules to apply
verification = firewall_api.check_rules(hostname)

if verification['rule_status'] == 'active':
return "Success: Host quarantined."
else:
 Even if the first API call returned 200, the rule didn't stick.
raise Exception(f"Reliability Failure: Quarantine command succeeded but rule inactive for {hostname}")
This transforms a “silent fail” into a noisy, actionable alert.
6. Hardening Infrastructure Under Load
Reliability in security means your defense mechanisms don’t collapse under their own weight. For example, a Web Application Firewall (WAF) dropping valid traffic because the CPU is pegged, or an EDR agent consuming 100% disk I/O.
Step‑by‑step guide to capacity testing:
Linux (Monitoring Agent Resource Usage under stress):
 Run a stress test on the machine
stress --cpu 8 --timeout 300 &

While stress runs, monitor the EDR/security agent's resource consumption
pidof edr_agent | xargs top -b -n 1 | head -10
 Or monitor specific process with iotop
sudo iotop -b -n 1 | grep edr_agent
If the security agent uses more than 20% CPU during the test, it will likely fail to protect during a real-world attack when the server is already busy.
What Undercode Say:
- Security without reliability is an illusion. You cannot protect an asset if you cannot depend on the systems that are supposed to monitor and defend it. The shift from pure security engineering to reliability engineering is not a change of career, but a necessary evolution of the role.
- Silent failure is the real advanced persistent threat. Sophisticated malware often gets the headlines, but in the day-to-day operations of an enterprise, degraded data quality and broken automations are more likely to cause a breach. We must treat the health of our data pipelines with the same rigor as we treat malware analysis.
Prediction:
In the next two years, we will see the formal rise of “Security Reliability Engineering” as a distinct discipline. Organizations will begin to mandate SLOs (Service Level Objectives) for detection pipelines and automation responses. The future of security hinges on the ability to build systems that are not just difficult to hack, but impossible to ignore when they break. AI will play a dual role here—both causing drift through changing data patterns and solving it by autonomously healing pipelines before human analysts ever notice a gap.
▶️ Related Video (88% Match):
🎯Let’s Practice For Free:
IT/Security Reporter URL:
Reported By: Ahmed Sobhi – Hackers Feeds
Extra Hub: Undercode MoN
Basic Verification: Pass ✅


