Listen to this Post
Introduction:
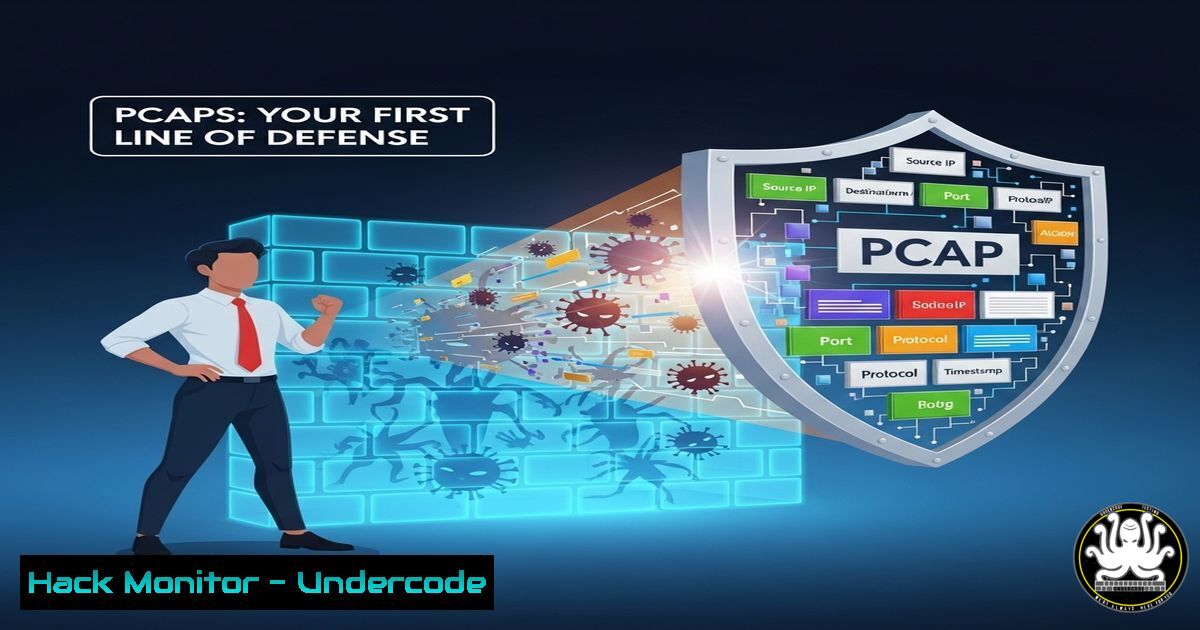
Packet captures (pcaps) have evolved from a niche, intimidating tool into an indispensable first-response asset for IT and cybersecurity professionals. Moving beyond mere Wi-Fi RF design, modern troubleshooting and threat hunting demand the granular, undeniable evidence that only deep packet analysis can provide. This shift marks a fundamental change in operational workflows, turning pcaps into the ultimate source of truth for diagnosing everything from product bugs to sophisticated cyber-attacks.
Learning Objectives:
- Understand the critical role of packet captures in modern network diagnostics and cybersecurity incident response.
- Master the fundamental commands and tools for capturing traffic on both Linux and Windows systems.
- Learn to isolate and identify common network anomalies and security threats, such as deauthentication attacks, within a pcap file.
You Should Know:
1. Mastering the Basic Capture: tcpdump Fundamentals
The `tcpdump` utility is the cornerstone of command-line packet analysis on Linux and Unix-like systems. Its versatility allows for quick captures, filtering, and saving of packets for later analysis.
`tcpdump -i eth0 -w initial_capture.pcap -c 100`
Step-by-step guide:
-i eth0: This interface flag specifies which network interface to capture on. Replace `eth0` with your target interface (e.g., `wlan0` for Wi-Fi). Use `tcpdump -D` to list available interfaces.-w initial_capture.pcap: The `-w` flag writes the raw packets to a file named `initial_capture.pcap` instead of just printing them to the screen. This file can later be opened in Wireshark for detailed analysis.-c 100: This limits the capture to 100 packets, perfect for a quick, targeted snapshot without overwhelming your storage. Execute the command, generate the network traffic you wish to investigate, and the capture will stop automatically after 100 packets.
- Windows Packet Capture: Built-in Tools to the Rescue
Windows administrators are not left out; the built-in `netsh trace` command provides powerful, native capture capabilities without the need for additional software installation.
`netsh trace start capture=yes persistent=no maxsize=500 tracefile=C:\trace.etl`
Step-by-step guide:
netsh trace start: This initiates a new tracing session.capture=yes: Explicitly instructs the tool to capture packets.persistent=no: Ensures the trace stops after a single capture session.maxsize=500: Limits the file size to 500 MB, preventing the capture from consuming excessive disk space.tracefile=C:\trace.etl: Defines the output path and filename. The `.etl` format is native to Windows and can be opened in Windows Performance Analyzer or converted for use in Wireshark. To stop the capture, runnetsh trace stop.
3. Isolating the Threat: Capturing Wi-Specific Attacks
Capturing on a Wi-Fi interface requires monitoring mode and specific filters to catch malicious traffic like deauthentication attacks, which are a common denial-of-service tactic against wireless networks.
`sudo tcpdump -i wlan0 -w wifi_capture.pcap -c 50 ‘type mgt and subtype 12’`
Step-by-step guide:
sudo: Required to elevate privileges for putting the interface into monitoring mode.-i wlan0: Specifies the wireless interface.'type mgt and subtype 12': This filter is crucial. It captures only management frames (type mgt) with the subtype specifically for deauthentication packets (subtype 12). This allows you to surgically capture evidence of a deauth attack with minimal noise. Run this command while the attack is ongoing to collect proof.
- The Power of Filtering: Zeroing in on the Problem
Effective pcap analysis is 90% filtering. Loading a multi-gigabyte file is useless without the skills to isolate relevant conversations. Wireshark’s display filters are key.`tcp.port == 443 && http2` | `ip.src==192.168.1.10` | `dns`
Step-by-step guide:
tcp.port == 443 && http2: This filter shows only traffic on port 443 (TLS/HTTPS) that is also using the HTTP/2 protocol, helping to debug modern web service issues.ip.src==192.168.1.10: Isolates all packets originating from the specific IP address 192.168.1.10. Replace with the source IP you are investigating.dns: Displays only DNS protocol packets, essential for diagnosing name resolution problems. Apply these filters in the display filter bar at the top of the Wireshark interface after loading your saved pcap file.
5. Validating Connectivity: The Classic Ping and Trace
Before diving into complex captures, always verify basic connectivity. These commands help determine if a problem requires a pcap or is a simpler layer 3 issue.
`ping -c 4 8.8.8.8` | `tracert 8.8.8.8` (Windows) | `traceroute -n 8.8.8.8` (Linux)
Step-by-step guide:
– `ping -c 4 8.8.8.8` (Linux/Mac): Tests basic reachability to Google’s DNS server by sending 4 ICMP echo request packets. Success implies routing and basic connectivity are functional.
– `tracert 8.8.8.8` (Windows): The Windows command for traceroute. It maps the network path to the destination, showing each hop and where delays or failures occur.
– `traceroute -n 8.8.8.8` (Linux): The Linux equivalent. The `-n` option prevents DNS lookups for each hop, speeding up the output. High latency or timeouts at a specific hop pinpoint the network segment causing the problem.
6. Analyzing for Exfiltration: Detecting Data Leaks
Pcaps can reveal data exfiltration attempts. Filtering for large data transfers or connections to unknown external IPs is a critical forensic technique.
`tcp.flags.syn == 1 and tcp.flags.ack == 0` | `tcp.analysis.bytes_in_flight`
Step-by-step guide:
tcp.flags.syn == 1 and tcp.flags.ack == 0: This filter shows only TCP SYN packets, which represent new connection attempts. A flurry of SYN packets to new external IPs could indicate malware beaconing or scanning.tcp.analysis.bytes_in_flight: This Wireshark filter helps identify packets carrying significant data payloads. Sorting this column in descending order can quickly show you the largest data transfers occurring in your capture, which is where to look for potential exfiltration.
- Decrypting the Web: Importing TLS Keys for Insight
Modern encryption hides content, but you can decrypt TLS traffic in Wireshark if you have the session keys, which is invaluable for debugging web app issues.
`export SSLKEYLOGFILE=~/path/to/sslkeylogfile.log`
Step-by-step guide:
- Before starting your capture, set the environment variable in your terminal:
export SSLKEYLOGFILE=~/path/to/sslkeylogfile.log. - Launch your web browser (e.g., Firefox, Chrome) from this same terminal session. The browser will now write TLS session keys to the specified log file as it makes encrypted connections.
- Perform your capture with `tcpdump` or Wireshark as normal.
- In Wireshark, go to
Edit -> Preferences -> Protocols -> TLS. - In the `(Pre)-Master-Secret log filename` field, browse to and select the `sslkeylogfile.log` you created.
- Reload the pcap. TLS traffic from the browser session will now be decrypted and visible in plaintext within Wireshark.
What Undercode Say:
- The First Principle of Evidence: Packet captures provide an objective, unopinionated record of network activity. They move diagnostics from conjecture and hypothesis into the realm of factual analysis, eliminating wasted time debating what might be happening.
- The Democratization of Deep Insight: Tools like Wireshark have GUI-fied powerful analysis that was once the domain of a small elite. The barrier to entry is no longer the tool’s complexity but the analyst’s commitment to learning fundamental networking concepts.
The professional’s journey from avoiding pcaps to demanding them first is a maturation of troubleshooting methodology. It signifies a shift from reactive guesswork to proactive, evidence-based investigation. In a landscape of increasingly complex attacks and opaque cloud environments, the pcap remains a universal constant—a raw, unfiltered log of truth on the wire. The initial investment in learning to capture and filter effectively pays exponential dividends in reduced mean time to repair (MTTR) and enhanced security posture. The network does not lie; you just have to learn how to listen to it.
Prediction:
The role of packet capture will not diminish but will become more integrated and automated. We are moving towards intelligent systems where AI-driven analytics engines will continuously monitor packet data in real-time, automatically flagging anomalies, mapping application dependencies, and providing root-cause analysis without requiring a human to manually sift through thousands of frames. The future of pcaps isn’t just about deeper analysis, but smarter, faster triage, transforming them from a reactive tool into a proactive security and performance monitoring platform.
🎯Let’s Practice For Free:
IT/Security Reporter URL:
Reported By: Santoseva I – Hackers Feeds
Extra Hub: Undercode MoN
Basic Verification: Pass ✅


