Listen to this Post
Introduction:
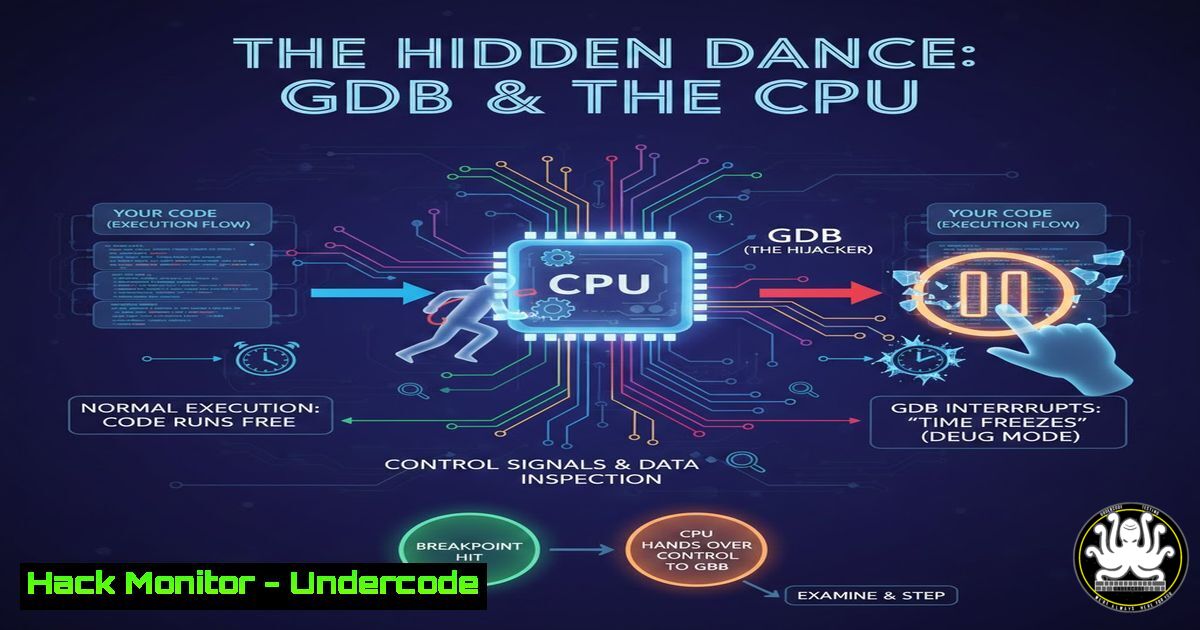
Software breakpoints are a fundamental tool for developers and security researchers, creating the illusion of stopping a program’s execution at a precise moment. This magic trick is a coordinated dance between your debugger, the operating system kernel, and the CPU’s interrupt mechanism. Understanding this process is crucial not only for effective debugging but also for comprehending software vulnerabilities, anti-debugging techniques, and advanced binary analysis.
Learning Objectives:
- Understand the complete lifecycle of a software breakpoint, from GDB command to CPU trap and back.
- Learn the role of the `INT3` instruction (opcode
0xCC) and how the Linux kernel handles the resulting exception. - Gain practical skills for setting breakpoints, inspecting process memory, and understanding the underlying mechanics using command-line tools.
You Should Know:
- The Illusion of Stopped Time: What Breakpoints Really Do
A software breakpoint doesn’t actually “stop” the CPU. Instead, it strategically hijacks the execution flow. When you set a breakpoint in GDB, it replaces the first byte of the instruction at the target memory address with a special software interrupt opcode. The program runs at full speed until the CPU encounters this byte, triggering a pre-defined routine that transfers control to the kernel, which then notifies the debugger. The debugger gives you, the user, the illusion that time has stopped, allowing you to inspect registers and memory.
Step‑by‑step guide:
- Write a simple C program:
echo 'int main(){ int x=5; return 0; }' > test.c && gcc -g -o test test.c.
2. Start GDB: `gdb ./test`.
- Set a breakpoint on
main:(gdb) break main. GDB will report the memory address (e.g.,0x1155). - Run the program:
(gdb) run. Execution pauses atmain. - Disassemble the current function:
(gdb) disassemble /r main. The `/r` option shows raw opcodes. Note the first instruction’s opcode at the breakpoint address. - Examine the original byte in memory before the breakpoint was set by looking at the executable file:
objdump -d test | grep -A 2 "<main>:". Compare this original opcode with the `0xCC` you see in GDB’s disassembly. -
The Magic Opcode: INT3 and the Trap to the Kernel
The special byte is the opcode for the `INT3` instruction (0xCC). It is a legacy from the x86 architecture’s software interrupt (INT n) family, specifically designed for debugging. When the CPU fetches and executes0xCC, it recognizes it as a trap exception. This causes the CPU to immediately stop executing the user program’s code, save its current state (the instruction pointer pointing to the next address), and jump to a predefined handler routine in the Linux kernel’s Interrupt Descriptor Table (IDT). This is the critical handoff from user space to kernel authority.
Step‑by‑step guide:
- In your paused GDB session from the previous section, examine the bytes at the breakpoint address: `(gdb) x/1xb 0x1155` (use your address). It should show
0xcc. - Temporarily remove the breakpoint and see the original instruction execute: `(gdb) set (unsigned char)0x1155 =
` (replace with the byte from <code>objdump</code>). Then single-step: <code>(gdb) stepi</code>. The original instruction executes.</li>
<li><p>Re-insert the breakpoint byte: <code>(gdb) set (unsigned char)0x1155 = 0xcc</code>. This manual process mimics what GDB does automatically.</p></li>
<li><p>Kernel as the Conductor: From Hardware Exception to User-Space Signal
The kernel's trap handler receives control from the CPU. It identifies that this `INT3` exception occurred in a process being traced by a debugger (thanks to the `ptrace` system call, which GDB uses to attach). The kernel doesn't restart the `INT3` instruction. Instead, it constructs a `SIGTRAP` (Signal Trap) signal and delivers it to the target process. However, because the debugger is the parent via <code>ptrace</code>, the kernel stops the target process and notifies the waiting debugger that a `SIGTRAP` occurred at a specific address. GDB then knows its breakpoint was hit.</p></li>
</ol>

<h2 style="color: yellow;">Step‑by‑step guide:</h2>

<ol>
<li>Use `strace` to see the `ptrace` system calls GDB makes: <code>strace -f -e trace=ptrace gdb -q ./test 2>&1 | grep ptrace</code>. You'll see `PTRACE_TRACEME` and <code>PTRACE_SETOPTIONS</code>.</li>
<li>In one terminal, run a program in the background: `sleep 100 &` and note its PID.</li>
<li><p>In another, attach to it with GDB: <code>gdb -p [bash]</code>. Before continuing, send a `SIGTRAP` to the process from a third shell: <code>kill -TRAP [bash]</code>. Observe in GDB that it stops, demonstrating how signals are intercepted.</p></li>
<li><p>Peeking Under the Hood: Inspecting the Breakpoint Mechanism
We can use Linux's powerful `/proc` filesystem to observe the process state from outside the debugger. The process's memory map and the exact state of its registers at the moment it was stopped are all exposed by the kernel. This is invaluable for writing debugging tools or understanding process introspection.</p></li>
</ol>

<h2 style="color: yellow;">Step‑by‑step guide:</h2>

<ol>
<li>Start your `test` program under GDB and hit the breakpoint. Find its process ID: <code>(gdb) info inferiors</code>.</li>
<li>In a separate shell, examine the process's memory map: <code>cat /proc/[bash]/maps</code>. This shows the executable's loaded segment, including the address range containing <code>main</code>.</li>
<li>Look at the current CPU register state stored by the kernel: <code>cat /proc/[bash]/task/[bash]/arch/x86/state/regs 2>/dev/null || sudo cat /proc/[bash]/task/[bash]/arch/x86/state/regs</code>. You'll see the saved `RIP` (instruction pointer) register pointing to the address after the `0xCC` byte.</li>
<li><p>Examine the precise byte at the breakpoint address from the OS perspective: <code>sudo gdb -q -p [bash] -ex "x/1xb 0x1155" -ex "detach" -ex "quit"</code>. This confirms the in-memory modification.</p></li>
<li><p>Memory Protection Tangles: When Breakpoints Meet Page Permissions
Memory pages can be marked as read-only (<code>PROT_READ</code>) to protect code. GDB's initial action of writing `0xCC` would cause a Segmentation Fault if the .text section wasn't writable. The kernel, via <code>ptrace</code>, temporarily overrides this protection to allow the debugger to insert the trap. This is a privileged operation a normal process cannot perform, highlighting the debugger's deep integration with the kernel.</p></li>
</ol>

<h2 style="color: yellow;">Step‑by‑step guide:</h2>

<ol>
<li>Write a program that makes its own code read-only using <code>mprotect()</code>.
[bash]
include <unistd.h>
include <sys/mman.h>
int main() {
long page_size = sysconf(_SC_PAGESIZE);
char start = (char)((long)main & ~(page_size - 1));
mprotect(start, page_size, PROT_READ); // Make code page read-only
return 0;
}
Compile: `gcc -o mprotect_test mprotect_test.c`.
- Try to write to `main` from within the program. It will crash.
- Now, run it under GDB and set a breakpoint on
main. GDB succeeds because `ptrace(PTRACE_POKEDATA, …)` allows the kernel to perform the write despitemprotect.
6. The Hacker’s Perspective: Breakpoints in Security Research
This very mechanism is a battleground. Malware and protected software use anti-debugging techniques to detect breakpoints. A common method is to calculate a checksum of their own code sections; the presence of `0xCC` alters the checksum. Conversely, security researchers use breakpoints to understand malware behavior, often scripting GDB or using frameworks like `pwndbg` to automate analysis and bypass these checks.
Step‑by‑step guide (Bypassing a simple checksum check):
- Write a function that checksums its own bytes.
include <stdio.h>
include <string.h>
int checksum_self() {
unsigned char ptr = (unsigned char)checksum_self;
int sum = 0;
for(int i=0; i < 20; i++) sum += ptr[bash]; // checksum first 20 bytes
return sum;
}
int main() {
if (checksum_self() != 1850) { // Example hardcoded sum
printf("Debugger detected!\n");
return 1;
}
printf("Normal execution.\n");
return 0;
}
2. Compile it: `gcc -o anti_debug anti_debug.c`.
- In GDB, set a breakpoint after the checksum function runs, not inside it.
- Or, use a hardware breakpoint (which doesn’t modify memory) on the check’s outcome: `(gdb) hbreak main+XX` (find the jump address after the check) and then modify the `EFLAGS` register to bypass the jump.
7. Beyond GDB: Breakpoints in the Modern Toolchain
Software breakpoints are not exclusive to GDB. Linux’s `perf` profiler uses them for dynamic tracing (perf probe). Reverse engineering platforms like IDA Pro or Ghidra implement them similarly. In Windows, the `DebugBreak()` function and the `INT3` instruction are used within the Win32 debugging API, with the kernel (ntoskrnl.exe) playing a role analogous to the Linux kernel in translating the exception to a debug event.
Step‑by‑step guide (Using `perf`):
- Add a dynamic tracepoint (which uses an INT3 under the hood) to the `main` function:
sudo perf probe -x ./test main. - Record a trace:
sudo perf record -e probe_test:main ./test. - View the report:
sudo perf report. This shows how profiling tools leverage the same CPU feature for observability.
What Undercode Say:
- The Illusion of Control: The seamless “pause” in a debugger is a complex illusion built on hardware exceptions, kernel mediation, and careful state management. This deep interplay is a cornerstone of software control and analysis.
- A Double-Edged Sword for Security: The very mechanism that enables legitimate debugging and vulnerability discovery is also used and defended against in offensive security. Understanding breakpoints is essential for both writing secure code and performing penetration testing or malware analysis.
The dance between debugger, kernel, and CPU reveals that software control is ultimately about intercepting and redirecting the flow of execution. This knowledge is power—it allows developers to build more reliable systems and enables security professionals to deconstruct malicious ones.
Prediction:
The fundamental mechanism of software breakpoints will remain, but its implementation and context will evolve. We will see increased integration with hardware-assisted virtualization (like Intel VT-x) for stealth debugging and hypervisor-based security tools. AI-assisted debuggers will begin to predict likely breakpoint locations based on code patterns or past crashes, automating much of the initial triage. Furthermore, in the realm of cybersecurity, advanced Anti-Tamper (AT) and Runtime Application Self-Protection (RASP) technologies will continue to develop more sophisticated and lower-level methods to detect or neutralize unauthorized debugging attempts, moving the battle from software traps to the hardware and hypervisor layers.
▶️ Related Video (80% Match):
🎯Let’s Practice For Free:
IT/Security Reporter URL:
Reported By: Paulo Almeida – Hackers Feeds
Extra Hub: Undercode MoN
Basic Verification: Pass ✅


