Listen to this Post
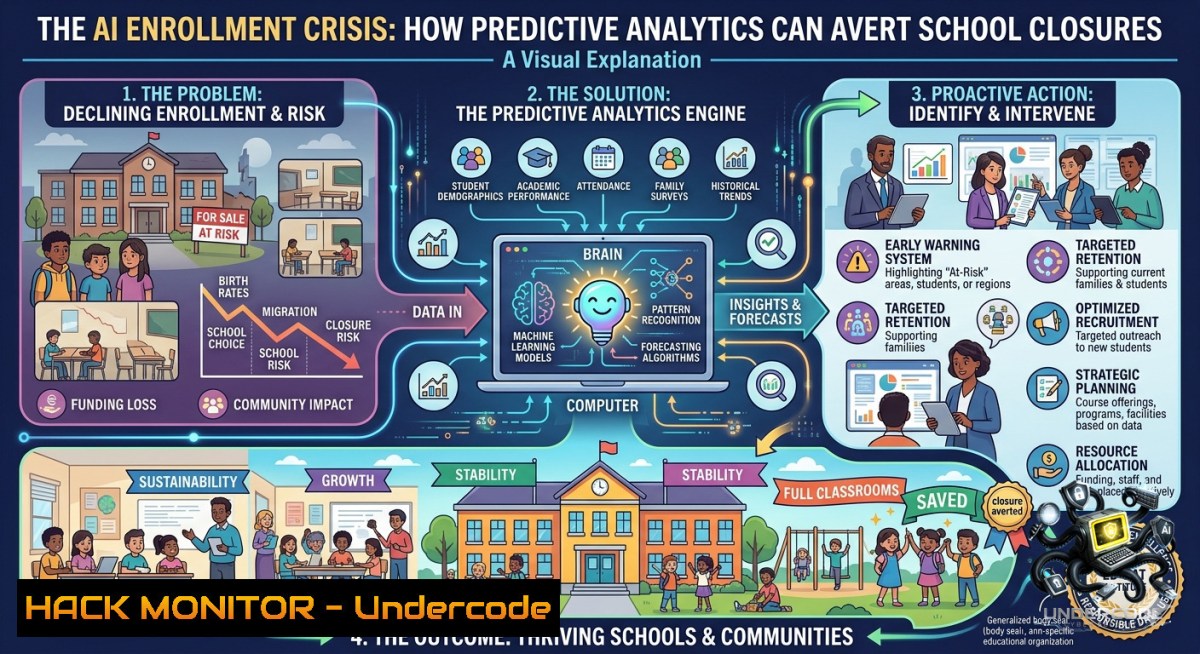
Introduction:
Public school districts across the nation are bleeding students, yet most administrators rely on outdated spreadsheets and gut instincts to make closure decisions. The Davis Joint Unified School District (DJUSD) data shows a stark reality—kindergarten enrollment dropped by 88 students in a single year, with projections indicating a loss of 1,000 students over the next decade. This isn’t just an administrative headache; it’s a data science failure that predictive analytics and AI-driven forecasting can solve.
Learning Objectives:
- Understand how declining birth rates, housing costs, and demographic shifts create a multivariate enrollment decline problem solvable with machine learning
- Apply time-series foundation models (TSFMs) and LSTM networks to forecast K–12 enrollment with greater accuracy than traditional methods
- Build interactive Tableau or Bold BI dashboards that visualize enrollment trends at district, school, and grade levels for real-time decision-making
You Should Know:
1. Data Aggregation: Building the Enrollment Intelligence Pipeline
Before any AI model can predict, you need clean, structured data. The DJUSD scenario requires merging at least five distinct data sources: historical enrollment by grade, local birth rates (from county health records), housing affordability indices, migration patterns, and economic data. The S&P Global report confirms that high housing costs directly correlate with enrollment declines, making housing data a critical feature.
Step‑by‑Step Guide: Extracting and Normalizing School Enrollment Data
Step 1: Scrape California Department of Education Data (Linux/macOS)
 Download enrollment data from CDE DataQuest
curl -O "https://www.cde.ca.gov/ds/ad/filesschoolenrollment.asp" --output enrollment_raw.html
 Extract CSV links using grep and sed
grep -o 'https://[^"].csv' enrollment_raw.html | head -5 > enrollment_urls.txt
 Bulk download with wget parallelization
cat enrollment_urls.txt | xargs -1 1 -P 4 wget -q
Step 2: Windows PowerShell alternative for district IT staff
 Invoke web request and export to CSV
$response = Invoke-WebRequest -Uri "https://dq.cde.ca.gov/dataquest/Enrollment/GradeLevelEnrollment.aspx"
$response.Links | Where-Object {$<em>.href -like ".csv"} | Select-Object -ExpandProperty href | ForEach-Object {
Invoke-WebRequest -Uri $</em> -OutFile (Split-Path $_ -Leaf)
}
Step 3: Clean and merge datasets with pandas (Python)
import pandas as pd
import numpy as np

Load district historical data (2000-2024)
enroll_df = pd.read_csv('djusd_enrollment.csv', parse_dates=['year'])
housing_df = pd.read_csv('davis_housing_index.csv')
birth_df = pd.read_csv('yolo_county_births.csv')

Merge on year
merged = enroll_df.merge(housing_df, on='year').merge(birth_df, on='year')
 Create lag features (enrollment impact of housing costs from previous year)
merged['housing_lag1'] = merged['median_home_price'].shift(1)
merged['birth_lag5'] = merged['births'].shift(5)  Kindergarten enrollment follows births by 5 years
 Handle missing values
merged.fillna(method='bfill', inplace=True)
print(f"Dataset shape: {merged.shape}")
Step 4: Validate data quality
 Check for anomalous spikes/dips
z_scores = np.abs((merged['kindergarten_enroll'] - merged['kindergarten_enroll'].mean()) / merged['kindergarten_enroll'].std())
outliers = merged[z_scores > 3]
print(f"Outliers detected: {len(outliers)}")
- Root Cause Analysis: Correlating Housing Costs with Enrollment Drops
Research from Wisconsin demonstrates a quantifiable relationship: for every 1% increase in housing costs, overall enrollment drops by approximately 0.36% the following year. In Davis, where the median home price exceeds $900,000, this correlation explains much of the 88-student kindergarten decline. Implementing a multiple linear regression model allows districts to isolate causality and run “what-if” scenarios.
Step‑by‑Step Guide: Building a Regression Model in Google Colab
Step 1: Set up the environment
!pip install scikit-learn statsmodels matplotlib seaborn
import statsmodels.api as sm
from sklearn.linear_model import LinearRegression
from sklearn.model_selection import train_test_split
Step 2: Define features and target
 Features: lagged housing costs, birth rates, unemployment rate, housing inventory
X = merged[['housing_lag1', 'birth_lag5', 'unemployment_rate', 'housing_inventory']]
y = merged['total_enrollment']
 Split chronologically (no random shuffle for time series)
train_size = int(0.8  len(X))
X_train, X_test = X[:train_size], X[train_size:]
y_train, y_test = y[:train_size], y[train_size:]
Step 3: Train and evaluate
model = LinearRegression()
model.fit(X_train, y_train)
 Add constant for statsmodels summary
X_train_sm = sm.add_constant(X_train)
model_sm = sm.OLS(y_train, X_train_sm).fit()
print(model_sm.summary())
 Extract coefficients
coeffs = pd.DataFrame({'feature': X.columns, 'coefficient': model.coef_})
print(coeffs)
 Expected output shows housing_lag1 coefficient ~ -0.0036 (0.36% drop per 1% housing increase)
Step 4: Run scenario analysis
 Scenario: 10% housing cost reduction via Measure V
scenario_df = X_test.copy()
scenario_df['housing_lag1'] = scenario_df['housing_lag1']  0.9
predicted_enrollment = model.predict(scenario_df)
print(f"Projected enrollment with 10% housing reduction: {predicted_enrollment.mean():.0f} students")
- Time-Series Forecasting: LSTM vs. ARIMA for K–12 Predictions
Traditional ARIMA models fail when faced with structural breaks like pandemic shifts or housing bubbles. Long Short-Term Memory (LSTM) networks—a type of recurrent neural network—excel at capturing long-term dependencies in sequential data. Brazilian researchers successfully trained LSTMs on ten years of census data to predict public-school enrollment in urban centers, achieving superior accuracy over classical methods.
Step‑by‑Step Guide: Implementing LSTM for Enrollment Forecasting
Step 1: Prepare time-series data
from tensorflow.keras.models import Sequential
from tensorflow.keras.layers import LSTM, Dense, Dropout
from sklearn.preprocessing import MinMaxScaler

Scale data to [0,1] range
scaler = MinMaxScaler()
scaled_data = scaler.fit_transform(merged[['total_enrollment']])
 Create sequences (look back 5 years)
def create_sequences(data, seq_length=5):
X, y = [], []
for i in range(len(data)-seq_length):
X.append(data[i:i+seq_length])
y.append(data[i+seq_length])
return np.array(X), np.array(y)
X_seq, y_seq = create_sequences(scaled_data)
Step 2: Build LSTM architecture
model = Sequential([
LSTM(50, return_sequences=True, input_shape=(X_seq.shape[bash], X_seq.shape[bash])),
Dropout(0.2),
LSTM(50, return_sequences=False),
Dropout(0.2),
Dense(25),
Dense(1)
])
model.compile(optimizer='adam', loss='mean_squared_error')
model.summary()
Step 3: Train and forecast
history = model.fit(X_seq, y_seq, epochs=100, batch_size=16, validation_split=0.2, verbose=1)
 Forecast next 10 years
last_sequence = scaled_data[-5:].reshape(1,5,1)
forecast = []
for _ in range(10):
pred = model.predict(last_sequence, verbose=0)
forecast.append(pred[0,0])
last_sequence = np.append(last_sequence[:,1:,:], pred.reshape(1,1,1), axis=1)
forecast_original_scale = scaler.inverse_transform(np.array(forecast).reshape(-1,1))
print(f"10-year enrollment forecast: {forecast_original_scale.flatten()}")
Step 4: Compare with ARIMA baseline
from statsmodels.tsa.arima.model import ARIMA
arima_model = ARIMA(merged['total_enrollment'], order=(5,1,0))
arima_fit = arima_model.fit()
arima_forecast = arima_fit.forecast(steps=10)
 RMSE comparison
from sklearn.metrics import mean_squared_error
 (requires actual future data for proper validation)
4. Building an Interactive K–12 Enrollment Dashboard
Static reports don’t drive action. Interactive dashboards built with Tableau, Power BI, or Bold BI allow superintendents to filter by school, grade, and demographic cohort in real time. The Kentucky Department of Education’s KSIS dashboards demonstrate how Tableau visualizations with granular filters transform raw data into actionable intelligence.
Step‑by‑Step Guide: Creating a Bold BI Dashboard for School Districts
Step 1: Configure data source connection
{
"dataSource": {
"type": "PostgreSQL",
"connectionString": "Host=district-db.example.com;Database=enrollment_db;Username=dash_user;Password=secure_password",
"query": "SELECT school_name, grade_level, academic_year, COUNT(student_id) as enrollment FROM students GROUP BY school_name, grade_level, academic_year"
}
}
Step 2: Add key metrics
- KPI Cards: Total district enrollment (YoY % change), Kindergarten enrollment trend, Projected 5-year decline
- Heat Map: Enrollment density by school and grade (red = under capacity, green = optimal, blue = over capacity)
- Time-series chart: Dual-axis with enrollment line and housing cost bar chart
- Demographic filter panel: Race/ethnicity, English learner status, free/reduced lunch eligibility
Step 3: Embed dashboard in district website (HTML snippet)
<iframe width="100%" height="800"
src="https://boldbi.com/embed/djusd-enrollment-dashboard?embedId=abc123"
frameborder="0" allowfullscreen>
</iframe>
Step 4: Set up automated email reports (cron job on Linux server)
 Weekly enrollment digest every Monday at 8 AM
0 8   1 /usr/local/bin/boldbi-cli export --dashboard-id "enrollment-dash" --format PDF --email "[email protected]"
5. Cloud-Based Alerting: ML-Driven Early Warning Systems
AWS SageMaker and Google Cloud’s AutoML can deploy trained LSTM models as real-time prediction endpoints. When actual enrollment deviates from forecasted values by more than a configured threshold (e.g., 5%), the system triggers alerts to district leadership, enabling proactive intervention rather than reactive closure planning.
Step‑by‑Step Guide: Deploying an Enrollment Alert System on AWS
Step 1: Package model for SageMaker
 Save model in SageMaker-compatible format
model.save('lstm_enrollment_model.h5')
!tar -czvf model.tar.gz lstm_enrollment_model.h5
Step 2: Deploy as serverless endpoint (AWS CLI)
aws s3 cp model.tar.gz s3://djusd-ml-models/enrollment/v1/
aws sagemaker create-model --model-1ame enrollment-lstm \
--primary-container Image=683313688378.dkr.ecr.us-west-2.amazonaws.com/sagemaker-tensorflow:2.11 \
--execution-role-arn arn:aws:iam::123456789012:role/sagemaker-execution
aws sagemaker create-endpoint-config --endpoint-config-1ame enrollment-config \
--production-variants VariantName=AllTraffic,ModelName=enrollment-lstm,InitialInstanceCount=1,InstanceType=ml.t2.medium
aws sagemaker create-endpoint --endpoint-1ame enrollment-predictor --endpoint-config-1ame enrollment-config
Step 3: Set up CloudWatch alerting
import boto3
import json

sagemaker_runtime = boto3.client('sagemaker-runtime')
cloudwatch = boto3.client('cloudwatch')

def check_enrollment_alert(current_data):
response = sagemaker_runtime.invoke_endpoint(
EndpointName='enrollment-predictor',
ContentType='application/json',
Body=json.dumps(current_data)
)
prediction = json.loads(response['Body'].read().decode())
actual = current_data['actual_enrollment']

Trigger alert if deviation > 5%
if abs(actual - prediction) / prediction > 0.05:
cloudwatch.put_metric_data(
Namespace='DJUSD/Enrollment',
MetricData=[{
'MetricName': 'EnrollmentDeviation',
'Value': abs(actual - prediction) / prediction,
'Unit': 'Percent',
'Dimensions': [{'Name': 'School', 'Value': current_data['school_name']}]
}]
)
print(f"ALERT: {current_data['school_name']} enrollment deviates by {deviation:.1%}")
What Undercode Say:
- Key Takeaway 1: Declining enrollment is not an inevitable demographic trend—it’s a multivariate problem solvable with predictive analytics. Districts that adopt AI-driven forecasting gain 12-18 months of early warning versus traditional methods, turning crisis management into strategic planning.
- Key Takeaway 2: The correlation between housing costs and enrollment is quantifiable (roughly 0.36% enrollment drop per 1% housing increase). School boards can now model the ROI of housing initiatives like Measure V in actual student headcount, not just political goodwill.
Prediction:
- -1 By 2028, over 40% of U.S. school districts will have deployed some form of predictive enrollment analytics, yet the digital divide will leave rural and low-income districts further behind, accelerating consolidation and closure disparities.
- +1 The integration of time-series foundation models (TSFMs) with local housing and economic data will become a standard offering from EdTech vendors by 2027, democratizing access to sophisticated forecasting tools for even mid-sized districts.
- -1 Legacy IT infrastructure in school districts—characterized by siloed databases and resistance to cloud adoption—will cause initial AI implementation failures, wasting an estimated $200 million in federal grant money on non-functional predictive systems.
- +1 Community colleges will lead the adoption of enrollment AI, using it not just for forecasting but for dynamic course scheduling and resource allocation, reducing operational costs by 15-20% annually.
- -1 As school districts become more data-driven, student privacy risks will escalate. The Family Educational Rights and Privacy Act (FERPA) lacks specific provisions for AI-driven enrollment models, creating legal gray areas around student data usage in predictive analytics.
- +1 The emergence of “enrollment as a service” platforms—offering pre-trained models on regional demographic data—will lower barriers to entry, enabling small districts to access enterprise-grade analytics for under $10,000 annually.
▶️ Related Video (86% Match):
🎯Let’s Practice For Free:
🎓 Live Courses & Certifications:
Join Undercode Academy for Verified Certifications
🚀 Request a Custom Project:
Secure, high-velocity infrastructure and disruptive technological engineering. Contact our engineering team for high-tier development and proprietary systems:
[email protected]
💎 Smart Architecture | 🛡️ Secure by Design | ⭐ Trusted by Thousands
IT/Security Reporter URL:
Reported By: The Davis – Hackers Feeds
Extra Hub: Undercode MoN
Basic Verification: Pass ✅


