
Listen to this Post
Introduction:
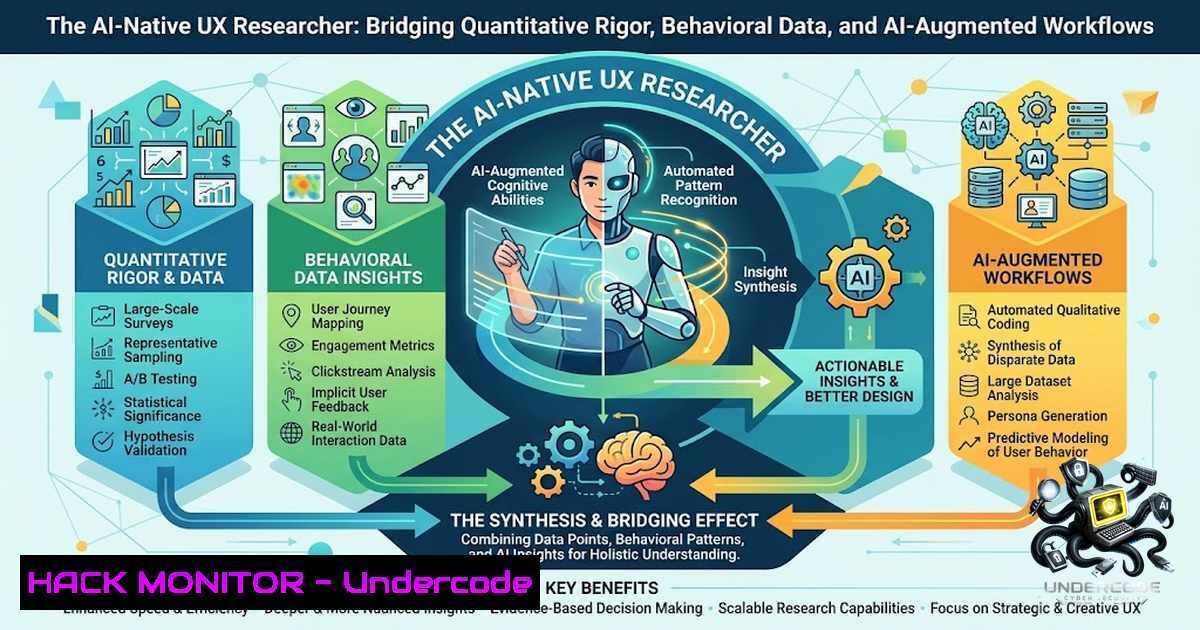
The UX research landscape is undergoing a fundamental transformation as organizations shift toward AI-1ative research practices that combine advanced quantitative analysis with AI-augmented workflows. At the forefront of this evolution is the UX Researcher — AI & Quantitative Specialist role, which demands expertise across three intersecting domains: AI tool integration within research workflows, advanced statistical methods (significance testing, regression, factor analysis, conjoint, and MaxDiff), and behavioral data extraction from platforms like Power BI, Amplitude, and Mixpanel. This article explores the technical competencies, tool configurations, and analytical frameworks required to excel in this emerging discipline, providing practitioners with actionable commands, code examples, and step-by-step guides for building AI-1ative research capabilities.
Learning Objectives & Secrets:
- Objective 1: Master AI-Augmented Research Workflows — Learn to integrate AI tools across the entire research lifecycle, from screener design and survey automation to synthesis, thematic analysis, and report generation. Secret tip: Implement AI-assisted qualitative coding using on-device LLMs like ChatQDA to maintain privacy while accelerating open coding workflows.
-
Objective 2: Deploy Advanced Quantitative Methods with Statistical Confidence — Develop proficiency in applying significance testing, regression analysis, factor analysis, conjoint analysis, and MaxDiff to UX datasets. Secret tip: Use R’s `cbcTools` package for choice-based conjoint experiment design and the `cjoint` package for Average Marginal Component Effects (AMCE) analysis.
-
Objective 3: Extract and Triangulate Behavioral Data at Scale — Build fluency in pulling and interpreting behavioral data from Power BI, Amplitude, and Mixpanel, then triangulating product usage data with primary research to surface actionable insights. Secret tip: Use Mixpanel’s JQL (JavaScript Query Language) for custom cohort retention analysis and Amplitude’s export API with Python pandas for behavioral segmentation.
You Should Know:
1. AI-Augmented Research Tool Stack Configuration
The modern AI-1ative UX researcher must navigate a diverse ecosystem of AI tools designed to accelerate every stage of the research process. According to the 2025 Future of User Research Report, UX professionals primarily use AI for analyzing research data (74%), generating research questions (54%), transcription (58%), and automating reports (49%). Key tools include Maze for end-to-end AI-assisted research, Synthetic Users for testing with AI participants at scale ($2–$27/simulated user), Dovetail and Condens AI for AI-assisted qualitative data synthesis, and UX Pilot as an AI-first research assistant.
Step-by-step guide for configuring an AI research synthesis pipeline:
- Set up Elicit API for evidence synthesis: The Elicit API enables programmatic calls for search, reports, and systematic reviews, integrating with Claude or ChatGPT plugins through MCP-compatible clients.
Example Elicit API call for literature synthesis import requests response = requests.post( "https://api.elicit.com/search", headers={"Authorization": "Bearer YOUR_API_KEY"}, json={"query": "UX research AI adoption barriers", "limit": 50} ) -
Deploy research-hub for literature workflow automation: Use the research-hub CLI, MCP server, and REST API to connect Zotero, Obsidian, and NotebookLM for repeatable literature workflows.
Install research-hub
pip install research-hub-pipeline
Initialize with Zotero API key
research-hub init --zotero-api-key YOUR_KEY
Run automated literature review
research-hub review --topic "AI-1ative UX research" --output summary.md
-
Implement on-device qualitative coding with ChatQDA: For privacy-preserving qualitative analysis, deploy open-source LLMs locally.
Clone ChatQDA repository
git clone https://github.com/example/chatqda
cd chatqda
Install dependencies and run local LLM server
pip install -r requirements.txt
python run_local_llm.py --model llama2 --port 8000
-
Quantitative Statistical Analysis in R for UX Research
Statistical methods are foundational to the quantitative UX researcher role, with significance testing, regression, factor analysis, conjoint, and MaxDiff identified as must-have competencies. The `r-uxr` package on CRAN provides convenience functions specifically designed for quantitative user experience testing and reporting.
Step-by-step guide for conducting key driver analysis with regression:
1. Load UX dataset and perform exploratory analysis:
library(r-uxr)
library(ggplot2)
 Load survey data with SUS scores and feature ratings
ux_data <- read.csv("ux_survey_data.csv")
 Descriptive statistics
summary(ux_data)
 Correlation matrix for key drivers
cor_matrix <- cor(ux_data[, c("SUS", "EaseOfUse", "Learnability", "Satisfaction")])
print(cor_matrix)
- Perform linear regression for key driver analysis: Regression analysis helps identify which combination of variables best predicts continuous outcomes like customer satisfaction, likelihood to recommend, or SUS scores.
Multiple linear regression
model <- lm(SUS ~ EaseOfUse + Learnability + Satisfaction + Efficiency, data = ux_data)
summary(model)
Extract standardized coefficients for driver importance
library(QuantPsyc)
lm.beta(model)
-
Conduct choice-based conjoint analysis using the `cbcTools` package for feature prioritization:
library(cbcTools)
Define product attributes and levels
profiles <- cbc_profiles(
price = c(9.99, 19.99, 29.99),
features = c("Basic", "Standard", "Premium"),
support = c("Email", "Chat", "Phone")
)
Design choice experiment
design <- cbc_design(
profiles = profiles,
n_responses = 200,
n_questions = 8,
n_alternatives = 3
)
Analyze with hierarchical Bayes
library(ChoiceModelR)
choices <- cbc_choices(design, respondent_id = "ID")
3. Behavioral Data Extraction from Amplitude and Mixpanel
The role requires hands-on experience pulling and interpreting behavioral data from platforms such as Power BI, Amplitude, and Mixpanel. These platforms enable user behavior tracking, funnel analysis, retention cohorts, and feature adoption measurement.
Step-by-step guide for extracting behavioral data from Amplitude using Python:
- Set up Amplitude API connection using the amplitude-data-wrapper:
from connections.amplitude import Amplitude from datetime import datetime, timedelta import json import pandas as pd Initialize Amplitude connection source = Amplitude('YOUR_API_KEY', 'YOUR_SECRET_KEY') Load event data for the last 7 days results = source.load(datetime.now() - timedelta(days=7)) events_df = pd.DataFrame(results) -
Query behavioral metrics with natural language using CData’s Python connector:
import pandas as pd
Connect to Amplitude via SQLAlchemy
connection_string = "amplitude://?Profile=C:\profiles\Amplitude.apip&ProfileSettings='APIKey=YOUR_API_KEY&SecretKey=YOUR_SECRET_KEY'"
df = pd.read_sql("SELECT Id, Date, EventType, UserId FROM ChartAnnotations WHERE Date > '2026-01-01'", connection_string)

Analyze feature adoption by cohort
feature_adoption = df.groupby(['UserId', 'EventType']).size().unstack(fill_value=0)
3. Perform funnel analysis and retention calculations:
 Calculate conversion funnel
funnel_steps = ['App_Opened', 'Account_Created', 'Feature_Used', 'Purchase_Completed']
funnel_data = {}
for step in funnel_steps:
funnel_data[bash] = df[df['EventType'] == step]['UserId'].nunique()

Calculate retention rates
from datetime import timedelta
week1_users = df[df['Date'] < '2026-01-08']['UserId'].unique()
week2_users = df[(df['Date'] >= '2026-01-08') & (df['Date'] < '2026-01-15')]['UserId'].unique()
retention_rate = len(set(week1_users) & set(week2_users)) / len(week1_users)
print(f"Week 1 to Week 2 Retention: {retention_rate:.2%}")
Step-by-step guide for Mixpanel behavioral cohort analysis using JQL:
1. Execute JQL queries for cohort analysis:
// JQL query for user retention cohort
function() {
var events = Events({
from_date: '2026-01-01',
to_date: '2026-01-31'
});

// Group events by user
var users = groupByUser(events, function(userEvents) {
var firstEvent = userEvents[bash];
var lastEvent = userEvents[userEvents.length - 1];
return {
user_id: firstEvent.user_id,
first_action: firstEvent.name,
last_action: lastEvent.name,
event_count: userEvents.length
};
});

// Filter for users who performed specific actions
return users.filter(function(user) {
return user.first_action === 'Signup' &&
user.event_count > 5;
});
}
2. Query saved funnels and retention curves:
 Using mixpanel-headless Python SDK
from mixpanel_headless import Mixpanel

mp = Mixpanel(api_key='YOUR_KEY', api_secret='YOUR_SECRET')

Query funnel by ID
funnel_result = mp.funnel(funnel_id=12345, from_date='2026-01-01', to_date='2026-01-31')

Query retention
retention_result = mp.query_retention(
event_name='Purchase_Completed',
from_date='2026-01-01',
to_date='2026-01-31',
retention_period='week'
)
- Power BI DAX for User Retention and Behavioral Metrics
Power BI enables UX researchers to visualize behavioral data and build interactive dashboards for stakeholder communication. DAX (Data Analysis Expressions) functions are essential for calculating user retention, cohort analysis, and product metrics.
Step-by-step guide for creating user retention measures in Power BI:
1. Calculate monthly active users cohort:
// Customers in Month 1
Customers Month 1 =
CALCULATE(
DISTINCTCOUNT(Users[bash]),
FILTER(
ALL('Calendar'),
'Calendar'[bash] >= MIN('Calendar'[bash]) &&
'Calendar'[bash] <= EOMONTH(MIN('Calendar'[bash]), 0)
)
)

// Customers in Month 2 (retained)
Customers Month 2 =
CALCULATE(
DISTINCTCOUNT(Users[bash]),
FILTER(
ALL('Calendar'),
'Calendar'[bash] >= EOMONTH(MIN('Calendar'[bash]), 0) + 1 &&
'Calendar'[bash] <= EOMONTH(MIN('Calendar'[bash]), 1)
)
)

// User Retention Rate
User Retention =
DIVIDE(
[Customers Month 2],
[Customers Month 1],
0
)
2. Calculate customer lifetime value (LTV) with DAX:
// LTV Calculation
LTV =
VAR AvgOrderValue = AVERAGE(Orders[bash])
VAR PurchaseFrequency = COUNTROWS(Orders) / DISTINCTCOUNT(Orders[bash])
VAR CustomerLifespan = 12 // months
RETURN
AvgOrderValue  PurchaseFrequency  CustomerLifespan
3. Build cohort retention matrix:
// Cohort Retention Matrix
Cohort Retention =
VAR CurrentPeriod = MAX('Calendar'[bash])
VAR CohortStart = MINX(
FILTER(ALL(Users), Users[bash] <= CurrentPeriod),
Users[bash]
)
VAR MonthsSinceCohort = DATEDIFF(CohortStart, CurrentPeriod, MONTH)
RETURN
CALCULATE(
DISTINCTCOUNT(Users[bash]),
FILTER(
ALL(Users),
Users[bash] = CohortStart &&
DATEDIFF(Users[bash], Users[bash], MONTH) >= MonthsSinceCohort
)
)
5. Python Behavioral Data Analysis with Pandas
Python with pandas, NumPy, and visualization libraries is increasingly essential for UX researchers working with behavioral data. The role requires extracting, interpreting, and storytelling with behavioral data, identifying patterns that inform hypothesis generation.
Step-by-step guide for behavioral data analysis in Python:
1. Load and preprocess behavioral data:
import pandas as pd
import numpy as np
import matplotlib.pyplot as plt
import seaborn as sns
from scipy import stats

Load behavioral event data
events = pd.read_csv('user_events.csv', parse_dates=['timestamp'])

Create user session features
user_sessions = events.groupby(['user_id', 'session_id']).agg({
'timestamp': ['min', 'max', 'count'],
'event_type': lambda x: list(x)
}).reset_index()

Calculate session duration
user_sessions['duration_minutes'] = (user_sessions[('timestamp', 'max')] -
user_sessions[('timestamp', 'min')]).dt.total_seconds() / 60
2. Perform funnel analysis and identify drop-off points:
 Define funnel steps
funnel_events = ['page_view', 'product_view', 'add_to_cart', 'checkout_start', 'purchase_complete']

Calculate funnel conversion
funnel_counts = {}
for i, event in enumerate(funnel_events):
users_at_step = events[events['event_type'] == event]['user_id'].nunique()
funnel_counts[bash] = users_at_step

Calculate drop-off rates
funnel_df = pd.DataFrame(list(funnel_counts.items()), columns=['Step', 'Users'])
funnel_df['Conversion_Rate'] = funnel_df['Users'] / funnel_df['Users'].iloc[bash]  100
funnel_df['Drop_Off'] = funnel_df['Conversion_Rate'].pct_change()  -100

Visualize funnel
plt.figure(figsize=(10, 6))
plt.bar(funnel_df['Step'], funnel_df['Conversion_Rate'])
plt.title('Conversion Funnel Analysis')
plt.ylabel('Conversion Rate (%)')
plt.xticks(rotation=45)
plt.show()
- Conduct A/B test analysis with statistical significance testing:
Load A/B test data
ab_test = pd.read_csv('ab_test_data.csv')

Calculate conversion rates by variant
conversion_by_variant = ab_test.groupby('variant').agg({
'converted': ['sum', 'count']
}).reset_index()
conversion_by_variant.columns = ['variant', 'conversions', 'total']
conversion_by_variant['rate'] = conversion_by_variant['conversions'] / conversion_by_variant['total']

Perform chi-square test for statistical significance
from scipy.stats import chi2_contingency
contingency_table = pd.crosstab(ab_test['variant'], ab_test['converted'])
chi2, p_value, dof, expected = chi2_contingency(contingency_table)
print(f"Chi-square: {chi2:.4f}, p-value: {p_value:.4f}")

If p < 0.05, difference is statistically significant
if p_value < 0.05:
print("Statistically significant difference detected between variants")
4. Identify user behavioral patterns and segments:
from sklearn.cluster import KMeans
from sklearn.preprocessing import StandardScaler

Create user-level feature matrix
user_features = events.groupby('user_id').agg({
'session_id': 'nunique',  number of sessions
'event_type': 'count',  total events
'timestamp': lambda x: (x.max() - x.min()).days  days active
}).rename(columns={
'session_id': 'sessions',
'event_type': 'total_events',
'timestamp': 'days_active'
})

Normalize features and perform clustering
scaler = StandardScaler()
features_scaled = scaler.fit_transform(user_features)

kmeans = KMeans(n_clusters=4, random_state=42)
user_features['segment'] = kmeans.fit_predict(features_scaled)

Analyze segment characteristics
segment_analysis = user_features.groupby('segment').mean()
print(segment_analysis)
6. Survey Design and Quantitative Study Execution
The role demands designing, executing, and analyzing quantitative studies including large-scale surveys, concept tests, and benchmark studies. Surveys are used by 83% of research teams, making survey methodology a core competency.
Step-by-step guide for survey design and statistical analysis:
- Design effective survey questions using best practices: short words, vertical response formats, randomized order, neutral language, and opt-outs like “Don’t know” and “Prefer not to say”.
2. Calculate required sample size for statistical significance:
import math
from scipy.stats import norm

def calculate_sample_size(confidence_level, margin_of_error, population_proportion, population_size=None):
z_score = norm.ppf(1 - (1 - confidence_level) / 2)
p = population_proportion
q = 1 - p

if population_size:
sample_size = (z_score2  p  q) / (margin_of_error2)
sample_size = sample_size / (1 + (sample_size - 1) / population_size)
else:
sample_size = (z_score2  p  q) / (margin_of_error2)

return math.ceil(sample_size)

Example: 95% confidence, 5% margin of error, 50% proportion
n = calculate_sample_size(0.95, 0.05, 0.5)
print(f"Required sample size: {n}")
- Analyze survey data with descriptive and inferential statistics:
Load survey responses
survey = pd.read_csv('ux_survey_responses.csv')

Descriptive statistics
descriptive = survey.describe()

Reliability analysis with Cronbach's Alpha
from pingouin import cronbach_alpha
alpha, ci = cronbach_alpha(survey[['Q1', 'Q2', 'Q3', 'Q4', 'Q5']])
print(f"Cronbach's Alpha: {alpha:.3f}")

Group comparisons with t-tests
from scipy.stats import ttest_ind
group_a = survey[survey['segment'] == 'A']['satisfaction_score']
group_b = survey[survey['segment'] == 'B']['satisfaction_score']
t_stat, p_val = ttest_ind(group_a, group_b)
print(f"t-test: t={t_stat:.3f}, p={p_val:.4f}")
What Undercode Say:
-
Key Takeaway 1: AI-1ative Research Is Not Optional—It’s the New Baseline. The UX Researcher — AI & Quantitative Specialist role signals a fundamental shift in how research teams operate. Organizations are actively seeking professionals who can embed AI tools into every stage of the research workflow—not as an add-on, but as the core operating model. The ability to lead AI adoption initiatives, coach peers, and run enablement sessions is now a non-1egotiable competency.
-
Key Takeaway 2: Quantitative Rigor and Behavioral Data Fluency Are Non-1egotiable. The job description’s emphasis on “MUST HAVE” requirements—significance testing, regression, factor analysis, conjoint, MaxDiff, and behavioral data extraction from Power BI, Amplitude, and Mixpanel—reflects an industry-wide demand for researchers who can move beyond qualitative insights to deliver data-driven, statistically validated recommendations. Organizations increasingly expect UX researchers to triangulate product usage data with primary research, identifying behavioral patterns that inform hypothesis generation and research prioritization.
-
Analysis: This role represents the convergence of three previously distinct disciplines: UX research, data science, and AI engineering. The emphasis on cross-team capability building and AI-1ative ways of working indicates that organizations are investing in researchers who can drive cultural transformation, not just execute studies. The technical demands—Python, R, SQL, DAX, JQL, and statistical modeling—suggest that traditional UX research skills alone are no longer sufficient. Professionals entering this space must develop fluency in both qualitative empathy and quantitative rigor, positioning themselves at the intersection of human-centered design and data-driven decision-making. The rise of AI research synthesis tools like Elicit, research-hub, and Claude Science further underscores the need for researchers who can orchestrate AI-powered workflows while maintaining methodological integrity.
Prediction:
-
+1 The AI-1ative UX Researcher role will become the standard template for UX research positions at enterprise technology companies within 18–24 months, driving demand for professionals who combine traditional UX skills with data science and AI engineering competencies.
-
+1 AI-augmented research tools will reduce time-to-insight by 60–80%, enabling UX teams to conduct more frequent, larger-scale studies without proportional headcount increases.
-
+1 The integration of behavioral data platforms (Amplitude, Mixpanel) with AI synthesis tools will create new opportunities for real-time product optimization, with UX researchers transitioning from retrospective analysts to proactive, predictive advisors.
-
-1 The rising technical bar for UX researchers may create a skills gap, with many traditional UX professionals struggling to acquire statistical and programming competencies, potentially leading to workforce stratification between “AI-1ative” and “traditional” researchers.
-
-1 Over-reliance on AI-generated insights without proper statistical validation could lead to methodological errors and flawed product decisions, emphasizing the critical importance of maintaining quantitative rigor alongside AI adoption.
▶️ Related Video (84% Match):
https://www.youtube.com/watch?v=31G11_dteoQ
🎯Let’s Practice For Free:
🎓 Live Courses & Certifications:
Join Undercode Academy for Verified Certifications
🚀 Request a Custom Project:
Secure, high-velocity infrastructure and disruptive technological engineering. Contact our engineering team for high-tier development and proprietary systems:
[email protected]
💎 Smart Architecture | 🛡️ Secure by Design | ⭐ Trusted by Thousands
IT/Security Reporter URL:
Reported By: https://lnkd.in/p/e9UUkPqf – Hackers Feeds
Extra Hub: Undercode MoN
Basic Verification: Pass ✅


