
Listen to this Post
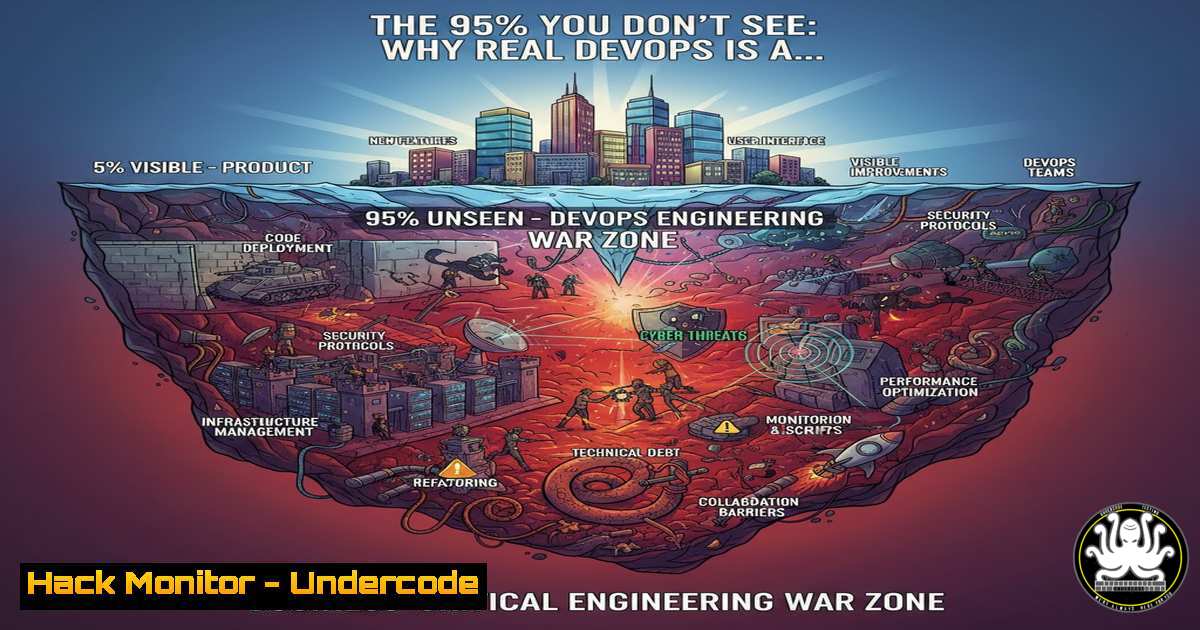
Introduction:
The common perception of DevOps as simply “automating deployments” is a dangerous oversimplification that leaves organizations vulnerable to catastrophic failure. In reality, modern DevOps engineering is a high-stakes discipline where the convergence of business risk, system uptime, and infinite scale demands a deep technical skillset. This article strips away the myth to reveal the hardcore engineering reality, providing the commands, configurations, and methodologies that separate true site reliability from mere script-kiddie automation.
Learning Objectives:
- Differentiate between superficial automation tasks and core infrastructure reliability engineering.
- Master critical Linux and Windows commands for incident response and system hardening.
- Implement secure, verifiable CI/CD pipelines and Infrastructure as Code (IaC) practices.
- Execute cloud cost optimization and capacity planning strategies using native tools.
You Should Know:
- Beyond the Pipeline: The Reality of Incident Response & System Forensics
When a critical alert fires at 3:00 AM, it’s not about the CI/CD pipeline; it’s about diagnosing a production outage where revenue loss ticks up by the second. The myth is that DevOps just fixes the build; the reality is forensic analysis under fire.
Step‑by‑step guide: Immediate Host-Level Triage
When a server goes down or latency spikes, you must investigate the running system before it crashes or recovers.
On Linux:
- Check Load and Uptime: `uptime` (shows load averages – if these exceed your CPU core count, you have a bottleneck).
- Identify Resource Hogs: `top` or `htop` (press `P` to sort by CPU, `M` to sort by memory). Identify any rogue processes.
- Analyze Disk I/O: `iostat -x 1` (if `sysstat` is installed). High `await` or `%util` indicates disk saturation.
- Review Recent Logs: `journalctl -u [service-name] –since “5 minutes ago”` or
tail -100 /var/log/syslog.
On Windows (PowerShell):
- Check Performance Counters: `Get-Counter -Counter “\Processor(_Total)\% Processor Time” -SampleInterval 2 -MaxSamples 5`
2. List Top Processes: `Get-Process | Sort-Object CPU -Descending | Select-Object -First 10`
3. Check Event Logs for Errors: `Get-EventLog -LogName System -EntryType Error -Newest 20`This isn’t automation; this is digital surgery. You use these commands to pinpoint if the issue is a memory leak in the application, a noisy neighbor on the VM, or a failing disk.
2. Architecting for Reliability, Not Just Speed
The myth says: “Push code fast.” The reality says: “Design systems that survive a total AZ failure.” This requires infrastructure decisions that prioritize resilience over feature velocity.
Step‑by‑step guide: Configuring an Auto-Scaling, Self-Healing Architecture
Using AWS as an example, you move beyond a single EC2 instance to a resilient architecture.
1. Launch Template: Define your instances with a user-data script that installs the application and joins it to a load balancer.
2. Target Group: Create a target group with a proper health check path (e.g., /health) that validates the application, not just the server.
3. Load Balancer: Deploy an Application Load Balancer (ALB) across multiple Availability Zones.
4. Auto Scaling Group (ASG):
- Attach the Launch Template and ALB.
- Set minimum/maximum/desired capacity (e.g., min 2, max 10).
- Create scaling policies based on CPU utilization or request count per target.
- Crucially, configure the ASG to replace unhealthy instances automatically.
This architecture ensures that even if an entire data center goes dark, your ASG launches new instances in the surviving AZ, and the load balancer routes traffic away from the dead ones.
3. Mastering Infrastructure as Code: Versioning and Rollbacks
The myth says DevOps uses YAML. The reality says DevOps treats infrastructure with the same rigor as application code, using version control, code reviews, and atomic rollbacks.
Step‑by‑step guide: Terraform State Management and Safe Rollbacks
Manual changes via the console are the enemy. Here’s how to manage AWS infrastructure safely with Terraform.
1. Remote State: Configure a remote backend (like S3 with DynamoDB locking) to store terraform.tfstate. This ensures your team is working on the same source of truth.
terraform {
backend "s3" {
bucket = "my-company-terraform-state"
key = "prod/network/terraform.tfstate"
region = "us-east-1"
dynamodb_table = "terraform-state-lock"
}
}
2. Plan and Review: Before applying, always run terraform plan. This shows exactly what will be created, modified, or destroyed.
3. Applying and Rolling Back: To roll back a change, you don’t “undo” in the cloud. You revert the code in your Git repository to a previous commit and run terraform apply. Terraform will calculate the difference between the current live state (stored remotely) and the desired state in your reverted code, and then destroy the faulty resources and recreate the old ones.
4. Cloud Cost Optimization: The FinOps Reality
The myth focuses on deploying new features. The reality is justifying the cloud bill and optimizing spend without breaking the service.
Step‑by‑step guide: Identifying and Eliminating Wastage
- Rightsizing Instances: Use AWS Compute Optimizer or native cloud monitoring to find underutilized instances. A VM running at 5% CPU for a month is wasted money.
- Implementing Auto-Scaling for Off-Hours: Use AWS Instance Scheduler or a custom Lambda function to stop non-production environments (Dev, Test) overnight and on weekends. A simple CloudFormation template can tag instances (e.g.,
Schedule=office-hours) and a Lambda triggered by CloudWatch Events can stop/start them. - S3 Lifecycle Policies: For log data or old artifacts, create a lifecycle policy to move data from Standard storage to Infrequent Access (cheaper) after 30 days, and to Glacier (archive) after 90 days. This can reduce storage costs by 70%.
5. Security, Secrets, and Access Control
The myth leaves security to a separate team. The reality is that DevOps bakes security into the pipeline (DevSecOps) and manages the blast radius of compromised credentials.
Step‑by‑step guide: Secrets Management with HashiCorp Vault
Never hardcode passwords or API keys in your code or even in CI/CD variables. Use a dedicated secrets management tool.
1. Run Vault in Dev Mode (for testing): `vault server -dev`
2. Store a Secret:
export VAULT_ADDR='http://127.0.0.1:8200'
vault kv put secret/my-app config/backend=“https://api.example.com” api_key=“abc123”
3. Retrieve a Secret via API (for your app): Your application can authenticate to Vault (using Kubernetes service accounts, AWS IAM roles, etc.) and fetch the secret at runtime.
curl --header “X-Vault-Token: $VAULT_TOKEN” \
http://127.0.0.1:8200/v1/secret/data/my-app | jq ‘.data.data.api_key’
This ensures secrets are never in the repository, are encrypted in transit and at rest, and have full audit logs of who accessed them.
6. The Glue: Observability (Metrics, Logs, Traces)
The myth sees monitoring as a simple “is it up?” check. The reality requires a deep understanding of system behavior through the “Three Pillars of Observability.”
Step‑by‑step guide: Setting up a Prometheus and Grafana Stack
1. Node Exporter (Linux): Install on target servers to expose kernel-level metrics. Run as a daemon: `./node_exporter &`
2. Prometheus Configuration (prometheus.yml): Tell Prometheus where to scrape metrics.
scrape_configs:
- job_name: ‘node’
static_configs:
- targets: [‘localhost:9100’, ‘server2:9100’]
3. Alerting Rules: Define critical alerts in Prometheus.
groups:
- name: instance_down
rules:
- alert: InstanceDown
expr: up == 0
for: 5m
labels:
severity: critical
4. Grafana Dashboard: Connect Grafana to the Prometheus data source and build dashboards. A good dashboard shows not just CPU, but request latency, error rates, and saturation points.
What Undercode Say:
- Key Takeaway 1: DevOps is an engineering discipline focused on stability and reliability, not a job title synonymous with “automation engineer.” The core value lies in preventing revenue loss and system failure.
- Key Takeaway 2: Technical depth across the stack—from Linux internals and networking to cloud architecture and security—is non-negotiable. A DevOps engineer must be a generalist with deep specialization in critical areas.
The oversimplification of DevOps as mere tool-chaining creates a dangerous skills gap. Organizations that fail to recognize the true scope of this role—from capacity planning in the boardroom to kernel debugging in the server room—are building their entire digital future on a foundation of sand. It is a business-critical function where failure to respect the craft directly translates to failure in the market.
Prediction:
As platforms like Kubernetes and serverless abstract away more low-level automation, the “automation” part of DevOps will become increasingly commoditized. The future DevOps engineer will evolve into a “Platform Engineer” or “Reliability Strategist,” focusing almost entirely on the intersection of business logic, complex distributed systems observability, and proactive cost/failure governance. The demand for engineers who understand why systems fail and how to architect for resilience, rather than just how to deploy, will skyrocket, widening the gap between scripters and true site reliability engineers.
▶️ Related Video (80% Match):
🎯Let’s Practice For Free:
IT/Security Reporter URL:
Reported By: Muhammad Ali – Hackers Feeds
Extra Hub: Undercode MoN
Basic Verification: Pass ✅


