
Listen to this Post
Introduction:
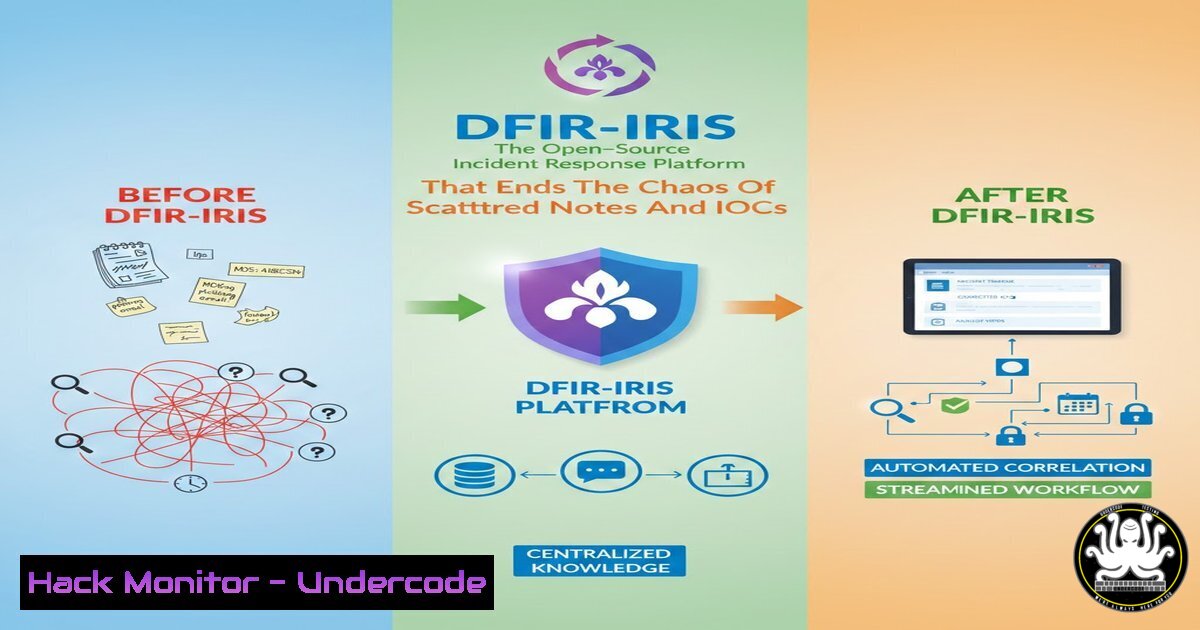
In the heat of a security incident, the last thing an analyst needs is digital chaos—IOCs scattered across emails, screenshots buried in Slack channels, and investigation notes lost in a Google Doc. DFIR-IRIS is an open-source, self-hosted collaborative platform designed to centralize every facet of incident response. By providing a unified interface for case management, observable tracking, and team collaboration, it transforms a frantic fire drill into a structured forensic investigation.
Learning Objectives:
- Understand the core architecture and features of DFIR-IRIS as a modern DFIR platform.
- Learn how to deploy DFIR-IRIS locally using Docker for a self-hosted incident response environment.
- Master the integration of IRIS with existing security stacks (MISP, Cortex, SIEM) to automate workflows.
- Explore practical steps for creating a case, ingesting alerts, and managing observables.
- Identify key commands and configurations to maintain and troubleshoot your DFIR-IRIS instance.
You Should Know:
- Zero-to-Hero: Deploying DFIR-IRIS with Docker in Under 5 Minutes
The power of DFIR-IRIS lies in its simplicity of deployment. It is containerized, meaning you can have a fully functional instance running on your analysis machine or server with minimal effort.
Step-by-step guide:
First, ensure Docker and Docker Compose are installed on your Linux instance (Ubuntu/Debian example).
 Update system and install Docker
sudo apt update && sudo apt upgrade -y
sudo apt install docker.io docker-compose -y

Start and enable Docker
sudo systemctl start docker
sudo systemctl enable docker

Clone the DFIR-IRIS repository
git clone https://github.com/dfir-iris/iris-web.git
cd iris-web

Copy the environment configuration template
cp .env.model .env

Build and run the containers
sudo docker-compose up -d
Once the containers are running, access the web interface at https://<your-server-ip>. The default credentials are typically `[email protected]` / `admin` (you must change these immediately).
- Ingesting Alerts: Simulating a SIEM Forwarding Alert to IRIS
IRIS shines when it acts as the central triage point. It can receive alerts via its comprehensive API. Let’s simulate a Suricata or Zeek alert being pushed into a new IRIS case.
Step-by-step guide:
First, generate an API key in the IRIS web interface (Settings -> API Keys). Then, use `curl` to create a case and add an observable.
 Set your API key and IRIS URL
API_KEY="YOUR_API_KEY"
IRIS_URL="https://localhost:443/api"
CASE_NAME="Test Incident - Malicious PowerShell"

<ol>
<li>Create a new case
curl -k -X POST "${IRIS_URL}/cases/add" \
-H "Authorization: Bearer ${API_KEY}" \
-H "Content-Type: application/json" \
-d '{
"case_name": "'"${CASE_NAME}"'",
"case_description": "Automated case creation from simulated SIEM alert.",
"client_id": 1
}'</p></li>
<li><p>Assuming case ID returned is 1, add an observable (IOC)
curl -k -X POST "${IRIS_URL}/cases/1/observables/add" \
-H "Authorization: Bearer ${API_KEY}" \
-H "Content-Type: application/json" \
-d '{
"observable": "malicious-payload.tld",
"observable_type": "domain",
"description": "C2 Domain from SIEM alert"
}'
This eliminates the manual copy-pasting of IOCs from email to a notepad.
3. Enriching Observables: Integrating Cortex for Automated Analysis
IRIS integrates directly with Cortex, TheHive’s analysis engine, to automatically run analyzers on your observables.
Step-by-step guide:
After deploying Cortex separately (or using an existing instance), configure it in IRIS:
1. Navigate to Settings -> Cortex.
- Add your Cortex instance URL and API key.
- Configure which analyzers (e.g., VirusTotal, AbuseIPDB, MaxMind) run automatically upon observable creation.
With this configured, every domain or IP added to a case is automatically enriched, providing context without leaving the platform.
4. Managing the Timeline: Reconstructing the Attack Chain
One of the most tedious parts of DFIR is reconstructing the timeline of events. IRIS allows you to add timeline entries manually or via API.
Step-by-step guide (via Web UI):
1. Open your active case.
2. Go to the Timeline tab.
3. Click “Add Entry.”
- Define the date/time, title (e.g., “Malicious process execution”), and description.
- Link the entry to specific observables or tasks.
For automation, you can ingest Windows Event Logs or Sysmon logs using a custom script that parses the logs and pushes them to the IRIS API.
5. Task Management: Tracking the Response Workflow
Incident response is a team sport. IRIS includes a built-in task management system to assign responsibilities.
Step-by-step guide:
Within a case, navigate to the Tasks section.
- Create a task: “Isolate compromised host.”
- Assign it to a team member.
- Set a due date and priority.
- Add checklists (e.g., “Confirm hostname,” “Verify network segmentation,” “Run EDR scan”).
This ensures that no step is missed during the chaos of containment.
6. Reporting: Generating Professional Documents Automatically
Writing the final report is often the most hated part of the job. IRIS automates this by collating all case data—timeline, tasks, observables, notes—into a template.
Step-by-step guide:
- Once the investigation is complete, go to the case’s Reporting tab.
- Select a template (IRIS includes default Word/PDF templates).
3. Click “Generate Report.”
- The system produces a comprehensive document containing the entire investigation narrative, ready for delivery to management or clients.
7. CLI Troubleshooting: Checking Logs and Container Health
As a self-hosted solution, you need to know how to check its health from the command line.
 Navigate to your IRIS directory
cd ~/iris-web

Check the status of all containers
sudo docker-compose ps

View logs for the main application container
sudo docker-compose logs -f app

Access the database container to run manual queries (if needed)
sudo docker-compose exec db psql -U iris_user -d iris_db
If the web interface is unreachable, these logs are the first place to look for errors like database connection issues or API misconfigurations.
What Undercode Say:
DFIR-IRIS represents a critical shift in the DFIR tooling landscape, filling the void left by TheHive’s transition to a closed-source model. Its strength lies not just in its feature set, but in its philosophy: true open-source, community-driven development that prioritizes the analyst’s workflow over managerial dashboards.
- Centralization is the killer feature: By forcing all data into a single pane of glass, IRIS reduces the mean time to respond (MTTR) by eliminating the “Where did I put that packet capture?” problem.
- API-First Design: The robust API means IRIS isn’t just a tool; it’s a platform. You can build your own automation scripts, integrate it into SOAR playbooks, or pipe data directly from your EDR.
- Analyst-Centric UI: The interface is clean and functional, designed for the high-stress environment of incident handling, not for quarterly business reviews.
By leveraging Docker for deployment and open standards for integration, IRIS democratizes enterprise-grade incident response capabilities, making them accessible to smaller security teams and MSSPs alike.
Prediction:
As TheHive’s community edition stagnates, DFIR-IRIS is poised to become the default open-source standard for collaborative incident response. We will likely see a surge in community-contributed modules, deeper integration with cloud-native security tools (like AWS GuardDuty and Azure Sentinel), and the emergence of managed IRIS-as-a-service offerings from boutique security consultancies. The platform’s roadmap, driven by real-world analyst feedback, will continue to refine automation, ultimately allowing human analysts to focus on threat hunting and complex forensics while IRIS handles the administrative overhead of case management.
▶️ Related Video (78% Match):
🎯Let’s Practice For Free:
IT/Security Reporter URL:
Reported By: Lamirkhanian Tu – Hackers Feeds
Extra Hub: Undercode MoN
Basic Verification: Pass ✅


