
Listen to this Post
Introduction
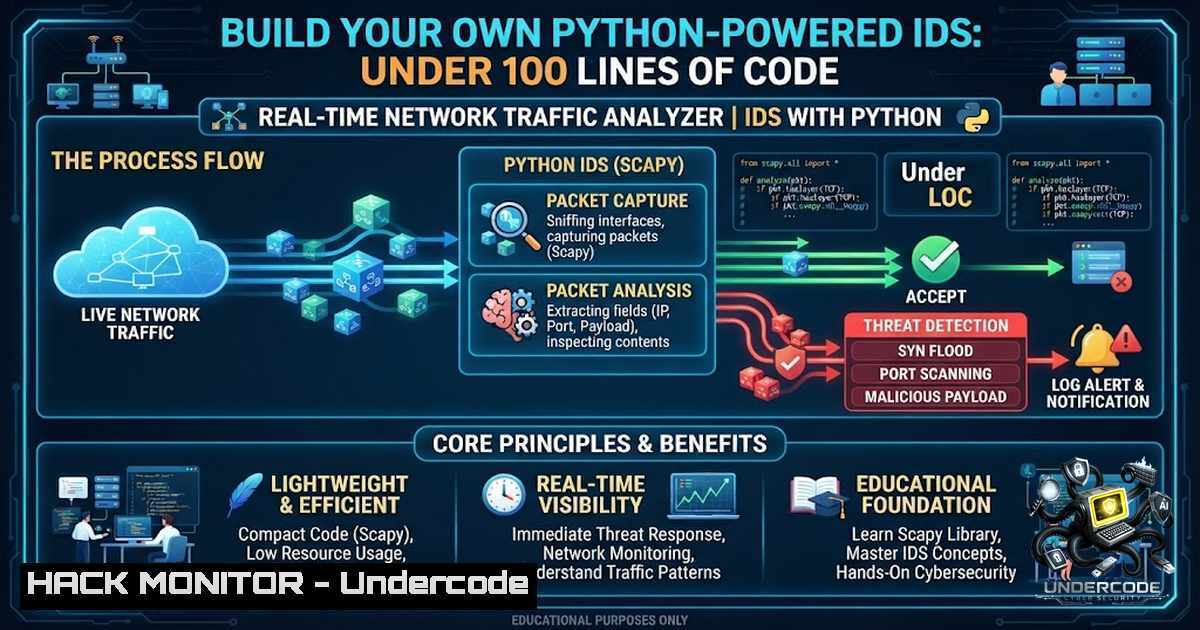
Network visibility is the cornerstone of modern cybersecurity defense. Without understanding what traverses your network perimeter, you are essentially flying blind against threats ranging from reconnaissance probes to data exfiltration. The Real-Time Network Traffic Analyzer project, part of a 100-day ethical hacking challenge, demonstrates how defenders can leverage Python and the Scapy library to build lightweight, custom intrusion detection capabilities that provide instant visibility into network activity, detect anomalies like SYN floods and port scans, and generate comprehensive HTML reports for offline analysis.
Learning Objectives
- Master live packet capture and protocol analysis using Python’s Scapy library
- Implement real-time anomaly detection for SYN floods, port scanning, and DNS tunneling indicators
- Generate automated security reports with HTML visualization for SOC operations and incident response
You Should Know
1. Understanding Scapy and Packet Capture Fundamentals
Scapy is a powerful Python packet manipulation library that enables crafting, sending, sniffing, and dissecting network packets at granular protocol layers. Unlike traditional tools like tcpdump or Wireshark, Scapy gives you programmatic control over every aspect of packet handling, making it ideal for building custom security tools.
The analyzer captures live traffic using Scapy’s `sniff()` function, which intercepts packets from a specified network interface. Each packet is then dissected to extract protocol information, source/destination addresses, and flags. The project implements two variants: a lightweight dashboard analyzer (traffic_analyzer.py) focused on protocol distribution and top talkers, and an expanded version (traffic_analyzer1.py) with connection tracking, DNS query monitoring, and comprehensive report generation.
Installation and Setup
Before running the analyzer, install the required dependencies:
 Install required Python packages
pip install scapy colorama netifaces
Scapy handles packet capture and manipulation, colorama enhances terminal output readability, and netifaces helps auto-detect the default network interface.
Running the Analyzer
The analyzer requires elevated privileges to sniff live network traffic. For the dashboard version:
 Capture traffic on the loopback interface for 15 seconds
sudo python3 traffic_analyzer.py --interface lo --duration 15

Capture on a specific network interface
sudo python3 traffic_analyzer.py --interface eth0 --duration 60
For the more detailed variant with connection tracking:
sudo python3 traffic_analyzer1.py --interface eth0 --duration 30 --output custom_report.html
The `–interface` parameter specifies which network interface to monitor, while `–duration` limits the capture window. Running on `lo` (loopback) is useful for safe lab testing and local traffic simulation.
2. Real-Time Anomaly Detection Engine
The analyzer implements three core anomaly detection mechanisms that mirror enterprise-grade intrusion detection systems:
SYN Flood Detection
A SYN flood attack occurs when an attacker sends a high volume of TCP SYN packets to a target, overwhelming its connection queue. The analyzer tracks SYN packets per destination IP and port, triggering an alert when the rate exceeds a configurable threshold. This detection logic is critical for identifying denial-of-service attempts in real time.
 Simplified SYN flood detection logic
if packet.haslayer(TCP) and packet[bash].flags == 0x02:  SYN flag
syn_count[bash][target_port] += 1
if syn_count[bash][target_port] > THRESHOLD:
alert(f"Potential SYN flood detected on {target_ip}:{target_port}")
Port Scan Detection
Port scanning is often the first phase of a targeted attack, where adversaries probe for open services. The analyzer detects port scans by monitoring the number of unique destination ports contacted by a single source IP within a short time window. A high count of distinct ports from one source triggers a port scan alert, enabling defenders to identify reconnaissance activity before exploitation occurs.
DNS Tunneling Indicators
DNS tunneling is a covert channel technique where attackers encode data within DNS queries to exfiltrate information or establish command-and-control communication. The analyzer flags potential DNS tunneling by examining query length, subdomain cardinality, and entropy of DNS query names. Unusually long or high-entropy DNS queries are strong indicators of tunneling activity.
3. HTML Report Generation for SOC Workflows
One of the analyzer’s most valuable features is automatic HTML report generation. After each capture session, the tool produces a structured HTML document containing:
- Real-time protocol statistics with percentage distributions
- Top source and destination IP addresses
- TCP/UDP connection summaries
- Detected anomalies with timestamps
This report format enables security analysts to quickly review network activity, share findings with team members, and maintain audit trails for compliance purposes. The HTML output is self-contained and can be opened in any modern browser without additional tools.
- Linux and Windows Commands for Network Traffic Analysis
Complementing the Python analyzer, these command-line tools provide additional network visibility:
Linux Commands
 Capture packets with tcpdump
sudo tcpdump -i eth0 -c 100 -w capture.pcap

View live traffic summary with tshark
sudo tshark -i eth0 -f "tcp" -T fields -e ip.src -e ip.dst -e tcp.port

Protocol hierarchy statistics
sudo tshark -r capture.pcap -z protocol,hierarchy -q

Display active network connections
ss -tunap

Monitor real-time bandwidth usage
nethogs eth0
Windows Commands (PowerShell)
 View active connections
netstat -an | Select-String "ESTABLISHED"

Capture packets using netsh (built-in)
netsh trace start capture=yes tracefile=C:\capture.etl
netsh trace stop

Monitor network statistics
Get-1etAdapterStatistics

Test connectivity and trace route
Test-1etConnection -ComputerName example.com -Port 443
Wireshark/TShark Display Filters
For deeper packet inspection, these display filters are invaluable:
 Filter HTTP traffic
http

Filter DNS queries
dns

Filter SYN packets
tcp.flags.syn == 1 && tcp.flags.ack == 0

Filter traffic to/from a specific IP
ip.addr == 192.168.1.100

Filter port scan patterns
tcp.flags.syn == 1 && tcp.flags.ack == 0 && tcp.window_size <= 1024
5. Extending the Analyzer for Production Environments
While the current implementation is designed for educational and lab use, it can be extended for production monitoring:
Integration with SIEM: Modify the analyzer to forward alerts to SIEM platforms like Splunk or Elasticsearch via REST APIs or syslog.
Persistent Storage: Add database support (SQLite, PostgreSQL) to store historical traffic data for trend analysis and forensic investigations.
Alerting Mechanisms: Implement email or Slack notifications for critical anomalies, enabling real-time incident response.
Performance Optimization: Use multi-threading or asynchronous I/O to handle high-throughput networks without packet loss.
Machine Learning Integration: Train ML models on baseline traffic patterns to detect zero-day anomalies beyond rule-based detection.
6. Alternative Network Analysis Tools
For comparison, these open-source tools offer similar functionality:
| Tool | Description | Best For |
||-|-|
| Wireshark | GUI-based packet analyzer with deep protocol inspection | Detailed forensic analysis |
| tshark | CLI version of Wireshark | Scriptable analysis and automation |
| Nmap | Network discovery and port scanning | Reconnaissance and vulnerability assessment |
| Zeek (formerly Bro) | Network security monitor with scripting capabilities | Enterprise-scale IDS/IPS |
| Suricata | High-performance IDS/IPS with rule-based detection | Threat detection at scale |
What Undercode Say
- Network visibility is non-1egotiable. The analyzer demonstrates that even a simple Python script can provide the situational awareness needed to detect early-stage attacks. Defenders cannot protect what they cannot see.
-
Anomaly detection is a force multiplier. By automating SYN flood, port scan, and DNS tunneling detection, the analyzer reduces the manual effort required to identify suspicious activity, allowing SOC teams to focus on high-priority incidents.
-
Automated reporting bridges the gap between detection and action. The HTML report generation transforms raw packet data into actionable intelligence, enabling faster decision-making during incident response and providing documentation for post-incident reviews.
The project highlights a critical truth in cybersecurity: effective defense doesn’t always require expensive commercial solutions. With foundational knowledge of Python and networking, security professionals can build custom tools tailored to their specific environment and threat model. The analyzer’s success in monitoring live traffic, detecting anomalies, and generating reports showcases how open-source tools can democratize network security monitoring.
Prediction
- +1 The democratization of network security tools will accelerate as more professionals adopt Python-based solutions like this analyzer, reducing reliance on proprietary vendors and enabling faster innovation in detection techniques.
-
+1 Integration of machine learning with lightweight packet analyzers will become standard, enabling adaptive threat detection that evolves with emerging attack patterns without requiring manual rule updates.
-
-1 The increasing sophistication of encrypted traffic (TLS 1.3, encrypted SNI) will limit the effectiveness of traditional packet inspection, forcing a shift toward behavioral analysis and endpoint-based detection.
-
-1 Attackers will increasingly leverage legitimate protocols like DNS and HTTPS for covert channels, making tunneling detection a critical but increasingly challenging capability for defenders to maintain.
-
+1 Automated HTML report generation will evolve into interactive dashboards with real-time visualization, enabling SOC analysts to correlate network activity with threat intelligence feeds for faster incident response.
-
+1 The 100 Projects Challenge model will inspire more structured, hands-on cybersecurity education, bridging the gap between theoretical knowledge and practical defensive skills required in modern SOC environments.
▶️ Related Video (78% Match):
https://www.youtube.com/watch?v=2CwvuFE8Txw
🎯Let’s Practice For Free:
🎓 Live Courses & Certifications:
Join Undercode Academy for Verified Certifications
🚀 Request a Custom Project:
Secure, high-velocity infrastructure and disruptive technological engineering. Contact our engineering team for high-tier development and proprietary systems:
[email protected]
💎 Smart Architecture | 🛡️ Secure by Design | ⭐ Trusted by Thousands
IT/Security Reporter URL:
Reported By: Abdulsalam401 Python – Hackers Feeds
Extra Hub: Undercode MoN
Basic Verification: Pass ✅


