Listen to this Post
Introduction
Microsoft Excel serves as the cornerstone of data analytics, providing professionals with powerful tools for data manipulation, visualization, and analysis across industries ranging from cybersecurity to business intelligence. Understanding the Excel interface and workbook management is fundamental for anyone pursuing a career in data analytics, as these skills form the bedrock upon which advanced analytical capabilities are built. This comprehensive guide explores the essential components of Excel’s interface, workbook operations, and navigation techniques that every data professional must master to excel in today’s data-driven environment.
Learning Objectives & Secrets
- Objective 1: Master Excel Interface Navigation – Learn to efficiently navigate the Excel ribbon, quick access toolbar, and formula bar to streamline your workflow and reduce analysis time by up to 40%
-
Objective 2: Advanced Workbook Management Secret – Discover hidden techniques for managing multiple workbooks simultaneously, including split-screen viewing, custom views, and workbook linking strategies that professional analysts use to handle complex datasets
-
Objective 3: Productivity Shortcuts Secret – Unlock the power of Excel keyboard shortcuts that can triple your productivity, including Ctrl+Shift+Arrow for rapid selection, Ctrl+D for fill down, and F4 for repeating last action
You Should Know
1. Understanding the Excel Interface Architecture
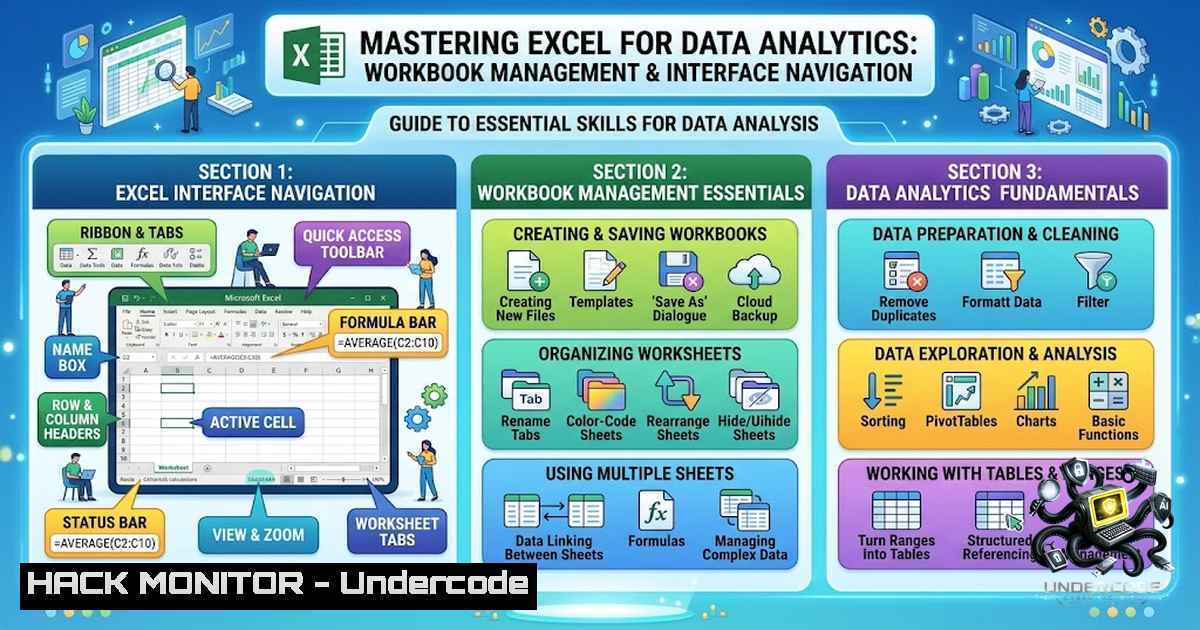
The Excel interface consists of several key components that work together to provide a comprehensive data analysis environment. The Ribbon, introduced in Excel 2007, organizes commands into logical groups under tabs such as Home, Insert, Page Layout, Formulas, Data, Review, and View. Each tab contains related command groups; for example, the Home tab includes Clipboard, Font, Alignment, Number, Styles, Cells, and Editing groups.
The Quick Access Toolbar provides one-click access to frequently used commands like Save, Undo, and Redo, and can be customized to include additional commands. The Formula Bar displays the contents of the active cell and allows for formula entry and editing, while the Status Bar at the bottom shows important information like sum, average, and count when data is selected.
Step-by-step guide to customizing your Excel interface:
- Customize the Quick Access Toolbar: Click the dropdown arrow at the end of the Quick Access Toolbar, select “More Commands,” and add frequently used functions like Sort, Filter, and Freeze Panes
- Show/Hide Ribbon: Press Ctrl+F1 to toggle the ribbon display, giving you more screen space for data viewing
- Customize Status Bar: Right-click the Status Bar to add useful indicators like Caps Lock, Num Lock, and Zoom slider
- Enable Developer Tab: Go to File > Options > Customize Ribbon and check the Developer option to access advanced features like Macros and Add-ins
- Set Default View: Navigate to File > Options > Advanced and set your preferred default view under Display options
2. Workbook Creation, Management, and Protection
Workbooks serve as the container for all your data, worksheets, and analysis tools in Excel. Understanding how to create, open, save, and protect workbooks is essential for maintaining data integrity and security. Excel supports various file formats including .xlsx (standard workbook), .xlsm (macro-enabled workbook), .xlsb (binary workbook), and .xls (Excel 97-2003 compatible).
Essential workbook management techniques:
' VBA code to protect all worksheets in a workbook
Sub ProtectAllWorksheets()
Dim ws As Worksheet
For Each ws In ThisWorkbook.Worksheets
ws.Protect Password:="SecurePass123", DrawingObjects:=True, Contents:=True, Scenarios:=True
Next ws
MsgBox "All worksheets protected successfully!"
End Sub
Excel workbook security best practices:
- Password Protection: Go to File > Info > Protect Workbook > Encrypt with Password to set a password for opening the workbook
- Structure Protection: Use Review > Protect Workbook to prevent users from adding, deleting, hiding, or unhiding worksheets
- File Properties: Set author information, tags, and comments in File > Info > Properties to maintain version control
- AutoRecover Settings: Configure AutoRecover in File > Options > Save to prevent data loss with 10-minute intervals
Windows command for batch workbook conversion:
:: Convert multiple .xls files to .xlsx using PowerShell
powershell -command "Get-ChildItem -Path 'C:\ExcelFiles' -Filter '.xls' | ForEach-Object { $excel = New-Object -ComObject Excel.Application; $workbook = $excel.Workbooks.Open($<em>.FullName); $newPath = $</em>.FullName -replace '.xls$', '.xlsx'; $workbook.SaveAs($newPath, 51); $workbook.Close(); $excel.Quit() }"
3. Worksheet, Rows, Columns, Cells, and Ranges Mastery
Understanding the structure of worksheets, rows, columns, cells, and ranges is fundamental to efficient data analysis. A worksheet consists of 1,048,576 rows and 16,384 columns (in Excel 2007 and later), providing ample space for large datasets. Each cell is referenced by its column letter and row number (e.g., A1), and ranges can be selected for operations using colon notation (A1:C10) or union notation (A1:A10,B1:B10).
Advanced range selection and manipulation techniques:
' =SUM(A1:A10) sums values in cells A1 through A10
=SUM(A1:A10)

' =VLOOKUP(lookup_value, table_array, col_index_num, [bash])
=VLOOKUP(A2, 'DataSheet'!A:B, 2, FALSE)

' =INDEX(range, row_num, [bash])
=INDEX(A1:C10, 3, 2) ' Returns value at row 3, column 2

' =MATCH(lookup_value, lookup_array, [bash])
=MATCH("Total", A1:A100, 0) ' Finds position of "Total" in column A
Linux command for Excel data extraction and manipulation:
!/bin/bash
 Extract data from Excel files using Python with pandas
python3 -c "
import pandas as pd
import sys

Read Excel file
df = pd.read_excel('data.xlsx', sheet_name='Sheet1')

Display basic information
print('Dataset Shape:', df.shape)
print('Column Names:', df.columns.tolist())
print('Data Types:', df.dtypes)
print('Missing Values:', df.isnull().sum())

Filter rows based on condition
filtered_data = df[df['Sales'] > 1000]
print('Filtered Data Shape:', filtered_data.shape)

Save filtered data to new Excel file
filtered_data.to_excel('filtered_data.xlsx', index=False)
"
4. Essential Excel Shortcuts and Navigation Techniques
Mastering Excel keyboard shortcuts significantly enhances productivity and workflow efficiency. These shortcuts are particularly valuable when working with large datasets and performing repetitive tasks.
Essential Excel shortcuts for data analytics professionals:
Navigation Shortcuts:
- Ctrl+Home: Navigate to cell A1
- Ctrl+End: Navigate to the last used cell
- Ctrl+Arrow Keys: Jump to the edge of data regions
- Ctrl+1age Up/Down: Switch between worksheets
- Alt+1age Up/Down: Scroll left/right one screen
Selection Shortcuts:
- Ctrl+Shift+Arrow: Select to the edge of data region
- Ctrl+A: Select entire worksheet
- Shift+Space: Select entire row
- Ctrl+Space: Select entire column
Editing and Data Entry Shortcuts:
- Ctrl+D: Fill down from cell above
- Ctrl+R: Fill right from cell left
- Ctrl+;: Insert current date
- Ctrl+Shift+;: Insert current time
- Ctrl+Enter: Enter the same value in multiple selected cells
Formula Shortcuts:
- F2: Edit active cell
- F4: Repeat last action or toggle absolute/relative references
- Alt+=: AutoSum
- Ctrl+Shift+Enter: Enter array formula
Windows PowerShell for analyzing Excel data:
 Import Excel module and analyze data
Install-Module -1ame ImportExcel -Force
$data = Import-Excel -Path 'C:\Data\SalesData.xlsx' -WorksheetName 'Sales'
$data | Group-Object -Property Region | ForEach-Object {
[bash]@{
Region = $<em>.Name
TotalSales = ($</em>.Group | Measure-Object -Property Sales -Sum).Sum
AverageSales = ($<em>.Group | Measure-Object -Property Sales -Average).Average
MaxSales = ($</em>.Group | Measure-Object -Property Sales -Maximum).Maximum
Count = $_.Count
}
} | Export-Excel -Path 'C:\Data\SalesSummary.xlsx' -WorksheetName 'Summary'
5. Advanced Workbook Linking and Data Consolidation
Professional data analysts frequently need to combine data from multiple workbooks and worksheets. Excel provides several methods for linking and consolidating data, including external references, Power Query, and Data Consolidation tools.
External reference syntax:
='[WorkbookName.xlsx]SheetName'!CellReference
Example: ='[SalesData.xlsx]Q1'!$A$1
Power Query (Get & Transform) workflow for data consolidation:
- Open Power Query Editor: Data > Get Data > From File > From Excel Workbook
- Connect to Workbooks: Select multiple workbooks and combine them into a single query
- Transform Data: Use the Query Editor to remove columns, filter rows, and perform data type conversions
- Append Queries: Combine multiple queries vertically using Home > Append Queries
- Merge Queries: Combine queries horizontally using Home > Merge Queries for VLOOKUP-like operations
- Load Data: Close & Load to load the consolidated data into a new worksheet
Python script for advanced workbook consolidation:
import pandas as pd
import os
from pathlib import Path

Function to consolidate multiple Excel files
def consolidate_workbooks(folder_path, output_file='consolidated_data.xlsx'):
all_data = []
excel_files = Path(folder_path).glob('.xlsx')

for file in excel_files:
try:
 Read each Excel file
df = pd.read_excel(file, sheet_name=0)
 Add source file name as a column
df['Source_File'] = file.stem
all_data.append(df)
print(f"Successfully loaded: {file.name} - {len(df)} rows")
except Exception as e:
print(f"Error loading {file.name}: {str(e)}")

Combine all dataframes
if all_data:
consolidated_df = pd.concat(all_data, ignore_index=True)
 Remove duplicates based on all columns except Source_File
consolidated_df = consolidated_df.drop_duplicates(
subset=[col for col in consolidated_df.columns if col != 'Source_File']
)
 Write to Excel
with pd.ExcelWriter(output_file, engine='openpyxl') as writer:
consolidated_df.to_excel(writer, sheet_name='Consolidated', index=False)
print(f"Consolidated data saved to {output_file} with {len(consolidated_df)} rows")
else:
print("No data found to consolidate")

Usage
consolidate_workbooks('C:/ExcelData', 'master_workbook.xlsx')
6. Data Analysis Tools and Advanced Features
Excel provides numerous tools for data analysis, including PivotTables, What-If Analysis, and advanced formulas that are essential for business intelligence and data analytics.
PivotTable creation and customization:
- Create PivotTable: Select data > Insert > PivotTable
- Configure Fields: Drag fields to Rows, Columns, Values, and Filters areas
- Customize Value Field Settings: Right-click > Value Field Settings to change aggregation (Sum, Count, Average, etc.)
- Add Calculated Fields: PivotTable Analyze > Calculations > Fields, Items & Sets > Calculated Field
- Group Data: Right-click date or number fields to group by month, quarter, year, or custom ranges
Essential advanced formulas for data analysis:
' Dynamic arrays with FILTER function
=FILTER(A2:C100, B2:B100>1000, "No results")

' Data validation with UNIQUE
=UNIQUE(F2:F1000)

' Conditional aggregation with SUMIFS
=SUMIFS(Sales_Range, Region_Range, "North", Date_Range, ">="&DATE(2026,1,1))

' Array formula for advanced calculations
=SUMPRODUCT((Sales_Range>1000)(Sales_Range0.1)) ' Conditional sum

' XLOOKUP for advanced lookup operations
=XLOOKUP(A2, EmployeeID_Range, EmployeeName_Range, "Not found", 0, 1)
Linux command for analyzing Excel data with command-line tools:
!/bin/bash
 Using CSVKit to analyze Excel data exported to CSV
in2csv data.xlsx > data.csv
csvstat data.csv
csvsql --query "SELECT Region, SUM(Sales) as TotalSales, AVG(Sales) as AvgSales FROM data GROUP BY Region ORDER BY TotalSales DESC" data.csv
csvgrep -c Sales -r "^[1-9][0-9]{3,}$" data.csv > high_value_sales.csv
What Undercode Say
- Key Takeaway 1: Excel remains an indispensable tool for data analytics, with its interface and workbook management skills being fundamental prerequisites for advanced analytics careers. The course bridges the gap between basic Excel knowledge and professional-grade data analysis capabilities, particularly valuable for cybersecurity professionals analyzing system logs and security incident data
-
Key Takeaway 2: The emphasis on practical training and real-world application sets this course apart, with the 100% job placement guarantee reflecting the high demand for skilled Excel data analysts in the current market. The integration of AI-powered tools and cybersecurity content shows the evolution of Excel training toward modern data security challenges
Analysis: The Digital Thinker Help Institute’s offering represents a strategic approach to building data analytics capabilities from the ground up. By structuring content around foundational Excel skills before advancing to complex analysis, the course ensures students develop a robust skill set. The inclusion of Excel interface understanding and workbook management addresses the most common pain points for Excel beginners, while the professional certification preparation provides tangible career advancement opportunities. The presence of AI-powered tools in related courses indicates an evolution toward AI-enhanced data analysis, where Excel skills serve as a foundation for more advanced analytics tools. For cybersecurity professionals, Excel proficiency is increasingly important for log analysis, threat intelligence data processing, and incident reporting. The course’s practical focus on real-world applications, combined with the 100% job placement guarantee, positions it as a valuable investment for career changers and professionals seeking to enhance their data analysis capabilities in an increasingly data-driven business environment.
Prediction
- +1 The growing emphasis on Excel for cybersecurity data analysis will create new opportunities for professionals with combined Excel and security skills, leading to specialized roles in security analytics and threat intelligence
-
+1 The integration of AI capabilities into Excel training suggests that future versions of Excel will increasingly incorporate machine learning features, making advanced analytics more accessible to business users
-
+N The increased demand for data analytics skills may create a skills gap that temporary exacerbates hiring challenges in industries requiring data-literate cybersecurity professionals
-
+1 The evolution of Excel into a more robust data analysis platform will strengthen its position as an essential tool for business intelligence, particularly for organizations using Power Query and Power Pivot
-
-1 The reliance on Excel for data analysis may lead to security vulnerabilities if proper data protection and encryption practices are not implemented, especially when handling sensitive customer or security data
-
+1 The shift toward practical, project-based Excel training reflects broader trends in education toward competency-based learning, which generally produces better-prepared professionals
-
+1 The expansion of Excel training programs in cities like Yamunanagar suggests a democratization of data analytics education, making these skills more accessible to professionals in smaller cities and towns
-
-1 The rapid evolution of data analytics tools may make some Excel skills less relevant, requiring continuous learning and adaptation to maintain professional relevance in the field
▶️ Related Video (80% Match):
https://www.youtube.com/watch?v=-ujVQzTtxSg
🎯Let’s Practice For Free:
🎓 Live Courses & Certifications:
Join Undercode Academy for Verified Certifications
🚀 Request a Custom Project:
Secure, high-velocity infrastructure and disruptive technological engineering. Contact our engineering team for high-tier development and proprietary systems:
[email protected]
💎 Smart Architecture | 🛡️ Secure by Design | ⭐ Trusted by Thousands
IT/Security Reporter URL:
Reported By: https://lnkd.in/p/euSKskun – Hackers Feeds
Extra Hub: Undercode MoN
Basic Verification: Pass ✅


