Listen to this Post
Introduction
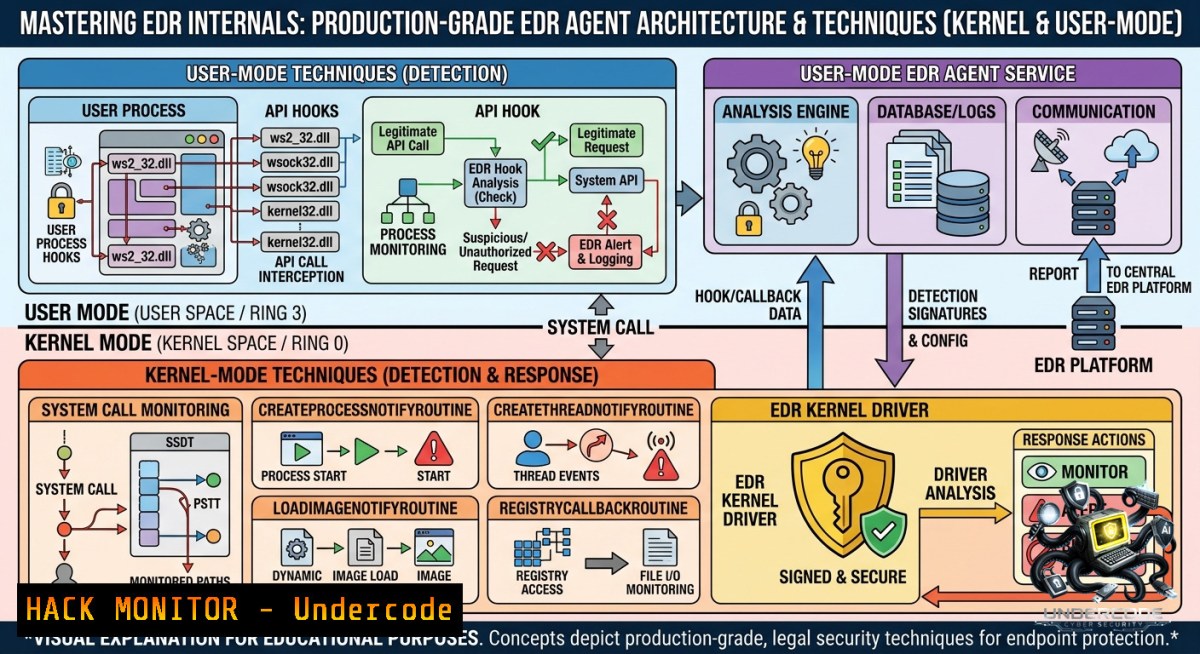
Modern Endpoint Detection and Response (EDR) systems are no longer just black boxes for security teams. Their core—the sensor that captures telemetry from deep within the Windows operating system—is a complex combination of kernel-mode drivers, protected services, and user-mode hooks. The Maldev Academy EDR Internals & Development course demystifies this black box by guiding students through the construction of a fully functional research EDR agent, MaldevEdr, which includes a PPL service, a user-mode DLL, an ELAM driver, and other kernel-mode components. This article distills the core technical concepts and attack vectors from that course, providing blue teamers and red teamers alike with a practical roadmap for understanding and building Windows EDR sensors.
Learning Objectives
– Objective 1: Analyze the core components of a Windows EDR agent, including PPL services, ELAM drivers, kernel callbacks, and filesystem minifilters, and understand their role in telemetry capture.
– Objective 2: Implement and test key defensive techniques such as syscall hooking, memory scanning, and ETW consumer logic using provided code samples and command-line utilities.
– Objective 3: Master both the offensive and defensive sides of EDR technology, including how to detect evasion tactics like indirect syscalls and call stack spoofing.
You Should Know
1. From Component to Sensor: Deconstructing the MaldevEdr Agent
The MaldevEdr agent is more than a collection of scripts; it is a purpose-built, modular research EDR that mirrors real-world products. Its architecture is designed to capture telemetry at every possible layer of the Windows operating system, from user-mode API calls down to kernel-mode filesystem operations. The agent includes a user-mode DLL responsible for hooking critical APIs; a PPL (Protected Process Light) service that prevents tampering; and an ELAM (Early Launch Antimalware) driver that initializes before other boot-start drivers to ensure the sensor is active from the moment the system starts.
The course breaks down how each of these components interacts. For instance, the ELAM driver registers with the Windows kernel to receive notifications about every process, thread, and image load. The PPL service, signed with the “Anti-Malware” signature, creates a hardened environment where the agent’s binaries can’t be terminated or modified by user-mode code. To see this in action, after installing a test driver, you can confirm its ELAM status by checking its signature level in the registry:
Get-ItemProperty -Path "HKLM:\SYSTEM\CurrentControlSet\Control\EarlyLaunch\"
Similarly, you can list all PPL processes on a system and verify your own agent’s protection level using a tool like PPLKiller or by querying the `SeProtectedProcess` field in tools like WinDbg or NtQueryInformationProcess.
2. Commanding Kernel Telemetry: Using Fltmc to Manage Filesystem Minifilters
One of the most critical components of any EDR is the filesystem minifilter—a kernel-mode driver that intercepts and inspects every file operation (create, write, read, delete, rename) in real time. The MaldevEdr agent includes a custom minifilter that uses callback functions (`PreOperation` and `PostOperation`) to analyze file IRPs and detect malicious writes or ransomware encryption patterns.
Managing these minifilters is typically done with the built-in Windows utility `fltmc.exe`. This tool allows you to load, unload, attach, and detach minifilters from volumes, providing granular control over file monitoring. Below is a practical guide to using `fltmc` for both development and live incident response:
– Load a minifilter driver: `fltmc load MyEdrFilter`
– Unload a minifilter driver: `fltmc unload MyEdrFilter`
– List all loaded minifilters and their attached volumes: `fltmc instances`
– Attach a minifilter to a specific volume: `fltmc attach MyEdrFilter C:`
– Detach a minifilter from a volume: `fltmc detach MyEdrFilter C:`
For developers building their own minifilter, the Windows Driver Kit (WDK) provides the `Filter` sample. After compiling your driver, you can use `fltmc` to test it in a virtual machine. The course goes a step further by explaining how to handle IRPs, queue them for user-mode analysis, and implement detection logic for malicious file activity without impacting system performance.
3. The Cat-and-Mouse Game: User-Mode Hooking and Syscall Evasion
To monitor process behavior, EDRs often place inline hooks inside `ntdll.dll`—the user-mode gateway to kernel system calls. By replacing the first few bytes of a `Nt` or `Zw` function with a `jmp` to their own monitoring code, EDRs can intercept calls like `NtCreateFile` or `NtAllocateVirtualMemory` before they reach the kernel. This is a key technique covered in the MaldevEdr user-mode DLL, where the agent hooks syscall stubs to flag suspicious activity such as shellcode injection or remote process memory writes.
Of course, attackers quickly adapted with indirect syscall and manual syscall techniques that bypass user-mode hooks by invoking the system call directly from their own code, skipping `ntdll.dll` entirely. In response, modern EDRs like MaldevEdr implement call stack tracing. By using kernel callbacks or ETW, the agent can inspect the call stack when an event fires, detecting anomalies such as a system call returning to a non-image memory region (indicating shellcode) or a missing return address (indicating indirect syscall execution).
To manually verify if a syscall is hooked on your system, you can use the HookDetector tool, which reads the bytes of each `Nt` export in `ntdll.dll` and compares them to a clean copy. A practical PowerShell approach to detect hooks is to compare the `ntdll.dll` on disk with its in-memory version:
$process = Get-Process -Id $pid
$ntdll = $process.Modules | Where-Object { $_.ModuleName -eq 'ntdll.dll' }
$bytesOnDisk = [System.IO.File]::ReadAllBytes($ntdll.FileName)
$bytesInMemory = New-Object byte[] $ntdll.ModuleMemorySize
[System.Runtime.InteropServices.Marshal]::Copy($ntdll.BaseAddress, $bytesInMemory, 0, $ntdll.ModuleMemorySize)
$diff = Compare-Object -ReferenceObject $bytesOnDisk -DifferenceObject $bytesInMemory
if ($diff) { Write-Host "Hooks detected!" }
This technique is fundamental to both building your own EDR (to monitor for unhooking attempts) and testing its resilience against evasion.
4. Unlocking ETW: Event Tracing for Windows as a Telemetry Goldmine
While kernel callbacks provide raw system events, Event Tracing for Windows (ETW) offers structured, high-fidelity telemetry from both kernel and user-mode providers. ETW is a built-in, high-performance logging system that powers Windows performance monitoring, security auditing, and many Microsoft security products. The MaldevEdr agent implements an ETW consumer to ingest events from providers such as `Microsoft-Windows-Threat-Intelligence`, `Microsoft-Windows-Kernel-Process`, and `Microsoft-Windows-Sysmon`, feeding them directly into its detection logic.
Unlike filesystem minifilters or syscall hooks, ETW operates largely outside the direct execution path of the monitored process, making it much harder for malware to bypass. However, it does not provide the same depth of inspection for individual API calls. The course explains how to balance these trade-offs: using ETW for broad, high-level telemetry (process creation, network connections, registry changes) and using kernel callbacks or minifilters for fine-grained, low-level inspection (file contents, memory regions, specific syscall arguments).
To explore ETW on your own system, use the command-line tool `logman.exe`. The following commands create, start, and stop a trace session for the Kernel Process provider, dumping events to an `.etl` file for later analysis with tools like `tracerpt` or Windows Performance Analyzer:
logman create trace KProcessTrace -p "Windows Kernel Trace" (process) -o C:\Traces\kprocess.etl -ets
logman start KProcessTrace -ets
logman stop KProcessTrace -ets
For EDR development, you would write a C++ routine that calls `StartTrace` and `ProcessTrace` to consume events in real-time, as demonstrated in the MaldevEdr source code. The course also covers advanced topics like Intel Processor Trace (PT) support for call stack enrichment and Last Branch Record (LBR) tracking to follow indirect branches—techniques used by next-generation EDRs to detect sophisticated control-flow hijacking.
5. Hardening the Sensor: Anti-Tampering, PPID Spoofing, and ELAM Drivers
A sensor is only useful if it cannot be disabled or evaded. The MaldevEdr agent incorporates multiple anti-tampering measures, many of which are directly ported from real EDR products. The most critical is the ELAM driver, which registers with Windows to be initialized before any third-party boot drivers. Using its `OnImageLoad` callback, the driver can inspect every subsequent driver as it loads, blocking those that are unsigned, unknown, or appear malicious. This ensures that even rootkits cannot load before the EDR sensor.
At the process level, the agent uses Process Protection (PPL) to run its service with the `WinTcb-Light` or `Anti-Malware-Light` level, preventing user-mode processes from opening a handle with `PROCESS_TERMINATE` or `PROCESS_VM_WRITE` access. However, as the course also teaches, PPL is not absolute—a kernel driver with sufficient privileges can still bypass it, which is why the ELAM driver and kernel callbacks work in concert to monitor for attempts to load malicious drivers.
Another evasion technique the course covers is PPID (Parent Process ID) spoofing, where a malicious process is created with a fake parent process to bypass EDR rules that rely on process tree heuristics. The EDR agent counters this by using process creation callbacks to record the actual parent PID and cross-referencing it with the `CreatedProcess` ETW event to detect inconsistencies. For blue teams, this is a powerful detection opportunity—if a child process claims a parent that did not actually create it, it is almost certainly malicious.
What Undercode Say
– Key Takeaway 1: Building a custom EDR agent is the single best way to understand how EDRs work and how to bypass them. The knowledge gained from writing kernel drivers, hooking syscalls, and consuming ETW events is directly applicable to both offense and defense.
– Key Takeaway 2: The cat-and-mouse game between EDRs and attackers has shifted from simple user-mode hooks to deep kernel inspection and sophisticated call stack analysis. To be effective, a modern EDR sensor must operate at multiple levels (ELAM, minifilter, kernel callbacks, ETW, and user-mode hooks) so that no single evasion technique can disable all telemetry.
Expected Output
A professional blue team or red team operator completing this course will be able to:
– Build and deploy a research EDR agent containing an ELAM driver, a PPL service, a user-mode DLL, and a filesystem minifilter.
– Implement detection logic for common malware behaviors (shellcode injection, ransomware encryption, process hollowing) using kernel callbacks and ETW.
– Test and bypass their own agent using indirect syscalls, call stack spoofing, and other evasion techniques, gaining a deep understanding of how to harden EDR sensors.
The course outputs a working EDR agent, MaldevEdr, which serves as a reference implementation for all the core techniques discussed above.
Prediction
– +1: As EDRs increasingly adopt ETW and kernel callbacks over user-mode hooks, attackers will be forced to develop more sophisticated kernel-level evasion techniques, driving innovation in both offensive and defensive research.
– -1: The widening gap between commercial EDRs and custom-built sensors will lead to a market consolidation where only the most advanced EDR vendors survive, reducing choices for small and medium businesses.
– +1: Open-source and research EDRs like MaldevEdr will democratize access to cutting-edge detection techniques, allowing smaller security teams and independent researchers to build affordable, high-quality EDR solutions tailored to their specific environments.
▶️ Related Video (80% Match):
🎯Let’s Practice For Free:
🎓 Live Courses & Certifications:
[Join Undercode Academy for Verified Certifications](https://undercode.co.uk/certifications/)
🚀 Request a Custom Project:
Secure, high-velocity infrastructure and disruptive technological engineering. Contact our engineering team for high-tier development and proprietary systems:
[[email protected]](mailto:[email protected])
💎 Smart Architecture | 🛡️ Secure by Design | ⭐ Trusted by Thousands
IT/Security Reporter URL:
Reported By: [One Of](https://www.linkedin.com/posts/one-of-the-most-exciting-parts-about-our-share-7467623277289558016-YTZJ/) – Hackers Feeds
Extra Hub: Undercode MoN
Basic Verification: Pass ✅
🔐JOIN OUR CYBER WORLD [ CVE News • HackMonitor • UndercodeNews ]
[💬 Whatsapp](https://undercode.help/whatsapp) | [💬 Telegram](https://t.me/UndercodeCommunity)
📢 Follow UndercodeTesting & Stay Tuned:
[𝕏 formerly Twitter 🐦](https://x.com/undercodeupdate) | [@ Threads](https://www.threads.net/@undercodetesting) | [🔗 Linkedin](https://www.linkedin.com/company/undercodetesting/) | [🦋BlueSky](https://bsky.app/profile/undercode.bsky.social)


