Listen to this Post
Introduction:
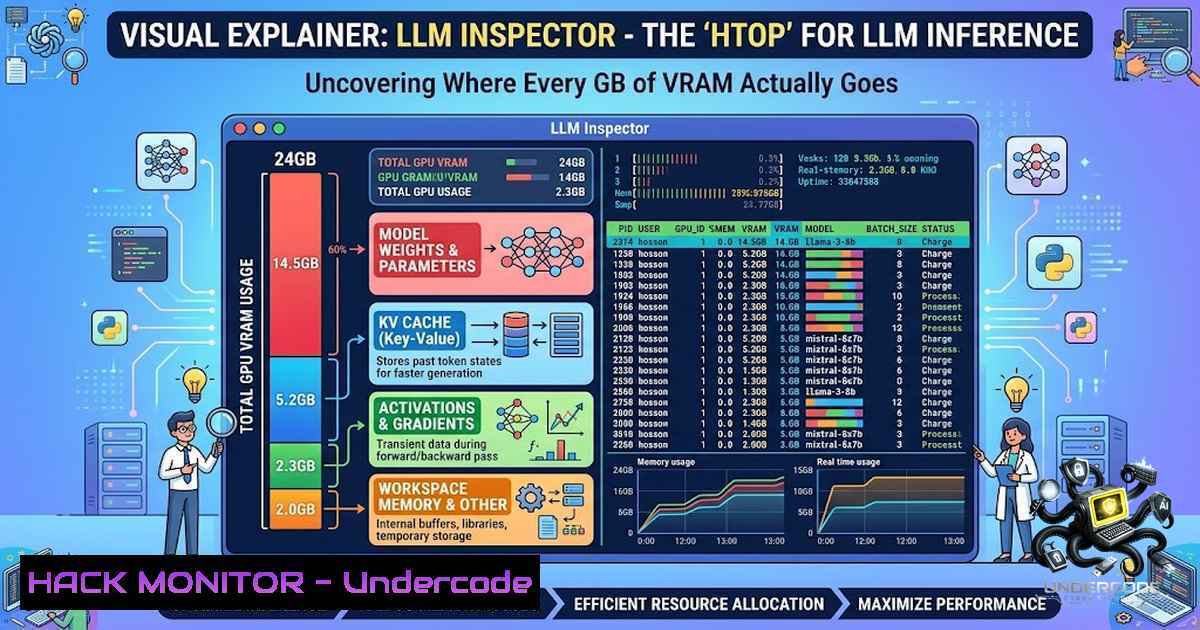
Running large language models locally has long been a game of guesswork when it comes to GPU memory management. Tools like `nvidia-smi` provide a high-level snapshot of total VRAM usage, but they offer zero visibility into the internal breakdown—leaving engineers blind to whether memory is consumed by model weights, the KV cache, or workspace allocations. LLM Inspector, now open source, changes this paradigm by providing granular, measured insights into inference memory consumption, alongside projected quantization savings that enable data-driven optimization decisions before any code is modified.
Learning Objectives:
- Understand the architectural components of LLM inference memory (weights, KV cache, workspace, activations) and how to measure each in real-time.
- Master the installation and usage of LLM Inspector across diverse environments, including local workstations, Docker containers, and DGX servers.
- Leverage projected quantization analysis (FP8, AWQ, GPTQ) to prioritize optimization strategies and reduce VRAM footprint without trial-and-error.
You Should Know:
- Installing LLM Inspector: From PyPI to Bare-Metal and Docker
LLM Inspector is designed to work on any NVIDIA GPU machine—whether a laptop, workstation, cloud VM, or enterprise DGX server. The installation process is straightforward and supports both host-level and containerized deployments.
Step‑by‑step guide:
For host installation (Ollama, vLLM, HuggingFace scripts running directly on the machine):
 Create a virtual environment (recommended)
python -m venv llm-inspector-env
source llm-inspector-env/bin/activate  Linux/macOS
 or llm-inspector-env\Scripts\activate  Windows

Install the base CLI
pip install llm-inspector

For deep metrics (weights, KV cache, activations), install with Torch support
pip install "llm-inspector[bash]"
For Docker-based inference services (typical production setups):
Add the following to your Dockerfile to embed the tool inside the container:
RUN pip install "llm-inspector[bash]"
After rebuilding and starting the container, inspect from the host using:
 List GPU processes inside the container
docker exec <container_name> llminspect ps

Inspect a specific PID
docker exec <container_name> llminspect inspect <PID> --verbose
Note: Always use PIDs from within the container’s namespace—never pass a host PID into docker exec.
For source installation (contributors or latest features):
git clone https://github.com/helasaoudi/llm-inspector
cd llm-inspector
python -m venv .venv && source .venv/bin/activate
pip install -e ".[bash]"
2. External Inspection: Zero-Code Memory Observability
The simplest way to use LLM Inspector is through external inspection, which requires no changes to your inference code. This mode leverages NVIDIA Management Library (NVML) and runtime APIs to gather process-level GPU memory usage, model metadata, and runtime configuration.
Step‑by‑step guide:
After installation, verify the tool is working:
llminspect --help
llminspect gpu  Display GPU information
List all GPU inference processes running on the system:
llminspect ps
This outputs a table similar to `ps` or htop, showing PIDs, GPU memory usage, and the associated model or process name.
Inspect a specific process by its PID (obtained from the `ps` output or nvidia-smi):
llminspect inspect <PID>
llminspect inspect <PID> --verbose  Shows provenance for every field
For a real-world test with Ollama running locally:
ollama run llama3.2
llminspect inspect $(pgrep -f "ollama serve") --verbose
This external mode provides measured data on GPU Used, process RAM, and runtime plugin information (e.g., vLLM’s `/v1/models` endpoint). However, deep metrics like weights/KV breakdown require embedded integration.
3. Embedded Integration: Unlocking Deep Metrics with `attach()`
To see where every gigabyte actually goes—weights vs. KV cache vs. workspace vs. activations—you need to embed LLM Inspector inside the inference process. This is achieved with a single function call after the model or engine is loaded.
Step‑by‑step guide:
For HuggingFace Transformers / PyTorch models:
from transformers import AutoModelForCausalLM
from llm_inspector import attach

model = AutoModelForCausalLM.from_pretrained(
"meta-llama/Llama-3.2-3B",
device_map="cuda"
)
attach(model=model)  Never raises exceptions; fails silently if import missing
After attaching, re-run the inspection command:
llminspect inspect <PID> --verbose
Now the output will include:
- GPU Allocated / Reserved / Peak – from PyTorch’s memory allocator
- Weights – total size of model parameters on GPU
- KV Cache – memory consumed by key-value tensors during generation
- Workspace – temporary buffers and scratch space
- Activations – intermediate tensors (if available)
For vLLM engines:
from vllm import LLM
from llm_inspector import attach

llm = LLM(model="meta-llama/Llama-3.2-3B")
attach(engine=llm.llm_engine)
For Coqui TTS or other custom PyTorch services:
def _attach_inspector(self):
try:
from llm_inspector import attach
attach(model=self.model)
except ImportError:
pass  Optional in development; fails gracefully in production
This embedded approach transforms LLM Inspector from a simple monitor into an inference advisor that can diagnose memory bottlenecks with surgical precision.
- Quantization Impact Estimation: Projected Savings Without Model Mutation
One of LLM Inspector’s most powerful features is its ability to project the memory savings from various quantization strategies—FP8, AWQ, GPTQ, and more—without actually quantizing the model. This allows engineers to evaluate “what-if” scenarios instantly.
Step‑by‑step guide:
After running an inspection with deep metrics enabled, the output includes an “Optimization Analysis” section. For a model with 7 GB of weights and 8 GB of KV cache, the tool might report:
– FP8 quantization would save ~3 GB of weights.
– AWQ would save ~5 GB of weights.
– Weight quantization won’t fix an 8 GB KV cache bottleneck.
This insight is critical: if the KV cache dominates memory usage, compressing weights alone is insufficient. The correct next step might be to reduce sequence length, enable sliding window attention, or use a more efficient cache format.
To view the provenance of every projected value, use the `–verbose` flag:
llminspect inspect <PID> --verbose
This shows exactly which measured inputs feed into each projected saving, ensuring transparency and trust in the recommendations.
5. Multi-Framework and Multi-Environment Support
LLM Inspector is framework-agnostic and supports the most popular LLM serving stacks out of the box:
| Framework | Support Level |
|–||
| Ollama | Full (host and container) |
| vLLM | Full with embedded `attach(engine=…)` |
| HuggingFace Transformers | Full with `attach(model=…)` |
| FastAPI / Custom PyTorch | Full with manual `attach()` |
| macOS (Apple Silicon) | Basic external inspection (no deep metrics without PyTorch CUDA) |
For enterprise DGX environments, the tool works seamlessly with the same APIs. The primary differences are Docker PID namespaces, GB10 NVML limits, and the vLLM EngineCore plugin—all handled transparently.
Troubleshooting tip: If deep metrics show as “Unavailable,” verify that:
– The `llm-inspector
` variant is installed in the same Python environment as the inference process.
- `attach()` is called after the model is fully loaded on the GPU.
- The process is running with CUDA available (<code>torch.cuda.is_available()</code> returns <code>True</code>).

<h2 style="color: yellow;">6. Linux and Windows Commands for Daily Operations</h2>

While LLM Inspector is primarily developed for Linux environments (common for GPU servers), it also runs on Windows with WSL2 or native Python. Below are essential commands for both platforms:

<h2 style="color: yellow;">Linux (Bash):</h2>

[bash]
 Install and verify
pip install "llm-inspector[bash]"
llminspect --help

List processes and inspect
llminspect ps
llminspect inspect $(pgrep -f "python.inference") --verbose

Monitor in real-time (watch mode)
watch -1 2 llminspect ps
Windows (PowerShell / CMD):
 Install (use WSL2 for CUDA support, or native if PyTorch CUDA is available)
pip install "llm-inspector[bash]"

List processes (PowerShell)
llminspect ps

Inspect a specific PID (replace 1234 with actual PID)
llminspect inspect 1234 --verbose

Continuous monitoring loop
while ($true) { llminspect ps; Start-Sleep -Seconds 2 }
Docker-specific commands (cross-platform):
 Inspect inside a running container
docker exec -it vllm-server llminspect ps
docker exec -it vllm-server llminspect inspect <PID> --verbose

For Docker Compose setups
docker compose exec vllm-service llminspect ps
What Undercode Say:
- Key Takeaway 1: LLM Inspector bridges the gap between system-level GPU monitoring and model-level memory introspection, providing actionable data that `nvidia-smi` and similar tools cannot offer. It answers the “why” behind memory usage, not just the “how much.”
-
Key Takeaway 2: The projected quantization analysis is a game-changer for optimization workflows. By estimating savings for FP8, AWQ, and GPTQ without model mutation, it enables engineers to prioritize interventions based on actual bottleneck analysis—preventing wasted effort on weight compression when the KV cache is the real culprit.
Analysis:
The open-sourcing of LLM Inspector arrives at a critical juncture in the LLM deployment lifecycle. As organizations move from prototype to production, the cost and complexity of GPU infrastructure demand precise resource accounting. Traditional monitoring tools treat the GPU as a black box, forcing engineers to rely on heuristics or expensive trial-and-error. LLM Inspector’s “measured, not guessed” philosophy introduces a new level of scientific rigor to inference optimization. The tool’s ability to distinguish between weights, KV cache, workspace, and activations mirrors the maturity of traditional software profiling (e.g., heap vs. stack vs. static allocation) and sets a new standard for AI infrastructure observability. Furthermore, the embedded `attach()` API ensures that deep metrics are available without invasive code changes, making it feasible for both development and production environments. The project’s MIT license and active community on GitHub signal a commitment to widespread adoption and continuous improvement.
Prediction:
- +1 LLM Inspector will become an essential component of the MLOps toolchain, similar to how `htop` and `perf` are staples for system administrators. Its adoption will accelerate as more organizations deploy custom fine-tuned models and need to optimize for cost and latency.
- +1 The projected quantization feature will drive a shift away from heuristic-based model selection toward data-driven optimization, potentially reducing average inference VRAM requirements by 30–50% across the industry.
- -1 As models grow larger and context windows expand, the KV cache will increasingly dominate memory consumption. Tools like LLM Inspector will highlight this trend, potentially exposing limitations in current attention mechanisms and prompting a new wave of research into memory-efficient architectures.
- +1 The open-source nature and extensible design will invite community contributions for additional optimization strategies (e.g., speculative decoding, paged attention tuning), further enhancing its utility.
- -1 Without proper integration into CI/CD pipelines and automated monitoring dashboards, the tool’s full potential may remain underutilized in enterprises that lack dedicated AI infrastructure teams.
▶️ Related Video (72% Match):
🎯Let’s Practice For Free:
🎓 Live Courses & Certifications:
Join Undercode Academy for Verified Certifications
🚀 Request a Custom Project:
Secure, high-velocity infrastructure and disruptive technological engineering. Contact our engineering team for high-tier development and proprietary systems:
[email protected]
💎 Smart Architecture | 🛡️ Secure by Design | ⭐ Trusted by Thousands
IT/Security Reporter URL:
Reported By: Hela Saoudi – Hackers Feeds
Extra Hub: Undercode MoN
Basic Verification: Pass ✅


