Listen to this Post
Introduction:
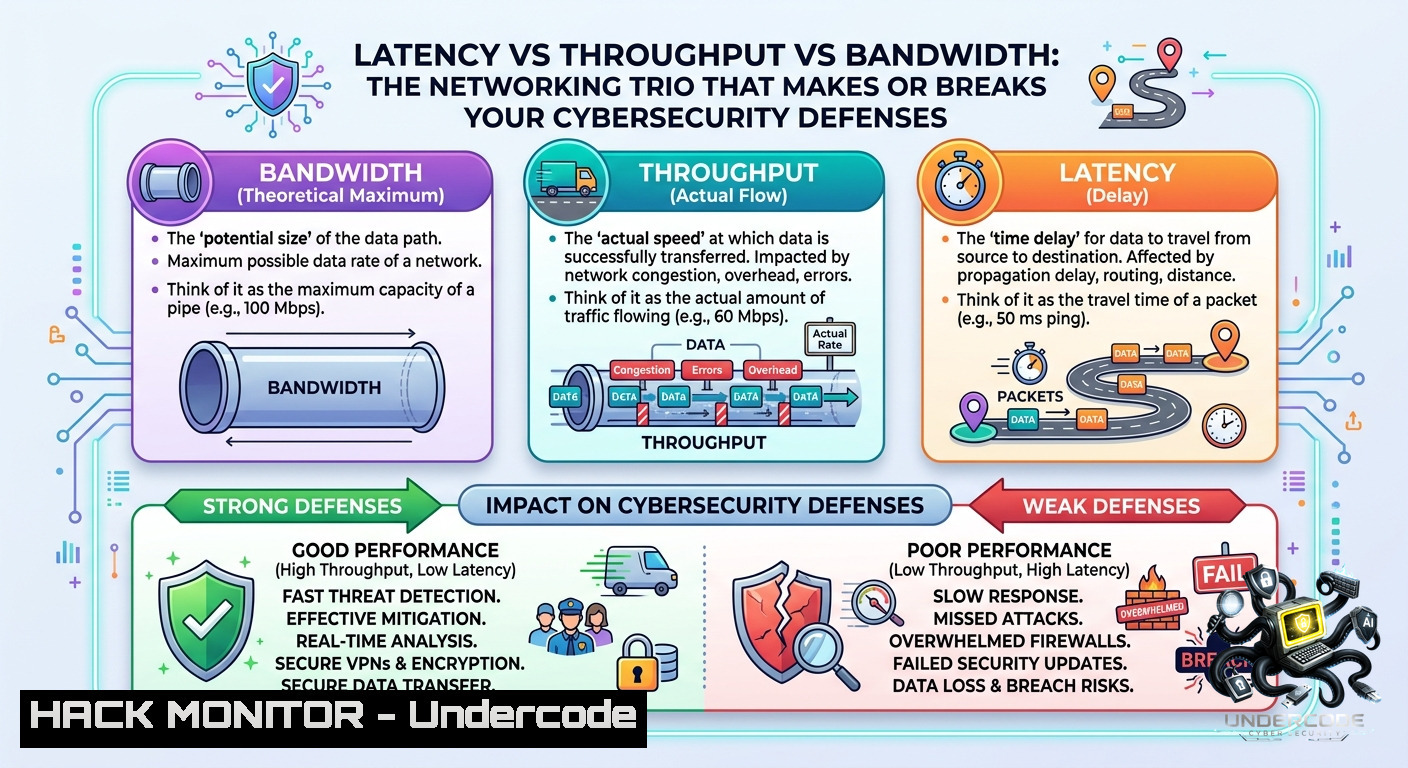
Network performance metrics like latency, throughput, and bandwidth are often used interchangeably, but they measure fundamentally different aspects of data delivery. In cybersecurity, misidentifying the bottleneck can lead to false conclusions—blaming a firewall when the real issue is latency-induced timeouts, or over-provisioning bandwidth while ignoring packet loss that cripples throughput. Understanding these three metrics is the first step toward effective network troubleshooting, cloud hardening, and incident response.
Learning Objectives:
– Differentiate between latency, throughput, and bandwidth using real-world scenarios and command-line tools.
– Diagnose network slowdowns, API performance issues, and security anomalies by measuring each metric independently.
– Apply mitigation strategies for latency-sensitive applications, throughput-heavy backups, and bandwidth saturation attacks.
You Should Know:
1. Measuring Latency: Step‑by‑Step with Ping, Traceroute, and MTR
Latency is the delay between sending a request and receiving a response. High latency ruins voice calls, slows AI inference, and causes API timeouts. Start by measuring baseline latency to your gateway, DNS server, or cloud endpoint.
Linux / macOS Commands:
 Ping with 10 packets, 1 second interval
ping -c 10 -i 1 8.8.8.8

 Traceroute to see each hop's latency
traceroute -1 google.com

 MTR (combines ping + traceroute) – install with sudo apt install mtr
mtr --report google.com
Windows Commands:
ping -1 10 8.8.8.8
tracert google.com
pathping google.com  Similar to MTR, shows loss and latency per hop
Step‑by‑step guide:
1. Ping your default gateway first (e.g., `ping 192.168.1.1`). Latency under 5 ms is typical for wired LAN; higher may indicate Wi-Fi congestion.
2. Ping an external IP like `1.1.1.1`. Expect 10–40 ms for fiber, 20–80 ms for cable, 100+ ms for satellite.
3. Use `mtr` or `pathping` to identify which hop introduces latency spikes. A problematic router will show high jitter or packet loss.
4. For API security testing, use `curl` with timing:
curl -w "Time_total: %{time_total}s\nTime_connect: %{time_connect}s\n" -o /dev/null -s https://api.example.com/health
High `time_connect` suggests network latency; high `time_starttransfer` suggests server processing.
2. Testing Throughput: Using iPerf3 for Network Link Validation
Throughput measures how much data actually moves from A to B—after accounting for latency, loss, and retransmissions. It is critical for backups, replication, and large file transfers.
Install iPerf3:
– Linux: `sudo apt install iperf3` or `sudo yum install iperf3`
– Windows: Download from iPerf.fr, or use `winget install iperf3`
– macOS: `brew install iperf3`
Step‑by‑step guide (client‑server test):
1. On the receiving side (e.g., cloud VM or remote office), start a server:
iperf3 -s -p 5201
2. On the sending side, run a 30‑second TCP test:
iperf3 -c <server_ip> -p 5201 -t 30 -P 4
`-P 4` runs 4 parallel streams to saturate high‑bandwidth links.
3. For UDP throughput (simulate real‑time traffic like video):
iperf3 -c <server_ip> -u -b 100M -t 30
4. Interpret results: The `receiver` section shows actual throughput. If it is significantly lower than bandwidth (e.g., 20 Mbps on a 100 Mbps link), check for packet loss (visible in UDP test) or congestion.
Security note: iPerf3 traffic is unencrypted. For production testing, use `nuttcp` with encryption or run over a VPN. Many attackers use iPerf3 for network mapping—monitor port 5201/tcp and 5201/udp in your SIEM.
3. Monitoring Bandwidth Utilization: CLI Tools and SNMP
Bandwidth is the maximum capacity of a link (e.g., your ISP plan: 100 Mbps). Utilization is the percentage currently used. When utilization approaches 100%, you get congestion, packet drops, and retransmissions.
Linux real‑time monitoring:
 Install iftop (display bandwidth per connection)
sudo apt install iftop
sudo iftop -i eth0

 nethogs – per‑process bandwidth
sudo nethogs eth0

 vnstat – long‑term utilization history
sudo vnstat -l -i eth0
Windows:
– Performance Monitor (`perfmon.msc`): Add counters `Network Interface()\Bytes Total/sec`
– PowerShell one‑liner for current utilization (replace “Ethernet”):
Get-1etAdapterStatistics -1ame "Ethernet" | Select-Object BytesReceivedPerSec, BytesSentPerSec
Step‑by‑step troubleshooting for bandwidth saturation:
1. Identify peak hours using `vnstat -d` (daily summary).
2. During a slowdown, run `iftop` to see which remote IPs consume the most bandwidth.
3. Check if traffic is legitimate (e.g., cloud backups) or malicious (e.g., DDoS, data exfiltration).
4. Mitigation: Implement QoS policies, rate limiting on firewalls (Palo Alto, Fortinet), or cloud‑native throttling (AWS WAF, Azure Front Door).
4. Packet Loss and Retransmissions: The Hidden Throughput Killer
Packet loss of just 1% can cut TCP throughput by 90% due to congestion control backoff. Latency and throughput problems often originate from loss, not bandwidth limits.
Check loss with:
– Linux: `netstat -s | grep -E “lost|retransmitted”`
– Windows: `netsh interface tcp show global` then `netsh interface tcp show statistics`
Use Wireshark for deep analysis:
1. Capture traffic: `tshark -i eth0 -w capture.pcap`
2. Filter for retransmissions: `tcp.analysis.retransmission`
3. Filter for duplicate ACKs: `tcp.analysis.duplicate_ack`
4. Loss ratio = (retransmitted segments) / (total data segments)
Step‑by‑step mitigation:
– Wired networks: Check cable integrity, switch port errors (`ifconfig` or `Get-1etAdapterStatistics`).
– Wireless: Change channel, reduce interference.
– Firewalls: Some inspection engines drop packets under load. Bypass IPS temporarily to test.
– Cloud: Use TCP BBR congestion control (Linux: `net.core.default_qdisc=fq` with `net.ipv4.tcp_congestion_control=bbr`).
5. Cloud Hardening and API Security: Applying Metrics to AWS/Azure and REST APIs
Latency, throughput, and bandwidth directly affect API security posture. High latency can mask slow‑loris attacks; low throughput may indicate rate limiting evasion.
AWS CloudWatch commands (AWS CLI):
 Check network throughput for an EC2 instance
aws cloudwatch get-metric-statistics --1amespace AWS/EC2 --metric-1ame NetworkIn --period 300 --statistics Average --dimensions Name=InstanceId,Value=i-12345

 Monitor VPN tunnel latency using NetworkMonitor
aws networkmonitor list-monitors
Azure:
 VM network throughput (PowerShell with Az module)
Get-AzMetric -ResourceId $vmId -MetricName "Network In Total" -TimeGrain 00:05:00
API security hardening (step‑by‑step):
1. Measure baseline API latency with `curl -w` (as shown in Section 1). Normal response <200 ms. 2. Implement rate limiting based on throughput per client IP. Example using `iptables` + `hashlimit`:
iptables -A INPUT -p tcp --dport 443 -m hashlimit --hashlimit-1ame api_rate --hashlimit-above 100/sec --hashlimit-burst 200 -j DROP
3. For cloud, use AWS WAF rate‑based rules or Azure DDoS Protection with per‑IP thresholds.
4. Monitor bandwidth utilization on API gateway subnets. Sudden 10× spikes often precede DDoS or credential stuffing.
6. Vulnerability Exploitation and Mitigation: Latency Side‑Channels and DDoS Bandwidth Saturation
Attackers exploit these metrics. Latency side‑channels (e.g., Prime+1robe in CPU caches) infer cryptographic keys from timing differences. DDoS attacks saturate bandwidth (volumetric) or exhaust connection tables (resource‑based).
Demonstrate a slow‑loris attack (educational only):
 Using slowloris.py against a test server
git clone https://github.com/gkbrk/slowloris.git
python3 slowloris.py <test_target> -p 80 -s 200
The attack keeps partial HTTP connections open, increasing latency for legitimate users until timeouts.
Mitigation steps:
– Against latency side‑channels: Disable hyper‑threading on sensitive hosts, use constant‑time crypto libraries.
– Against bandwidth saturation: Deploy Anycast, rate limiting on edge routers, or cloud scrubbing (Cloudflare, AWS Shield).
– Against connection‑table exhaustion: Configure firewalls to limit SYN‑rate per source IP.
 iptables SYN flood protection
iptables -A INPUT -p tcp --syn -m limit --limit 1/s --limit-burst 5 -j ACCEPT
iptables -A INPUT -p tcp --syn -j DROP
Windows Defender Firewall rate limiting (PowerShell):
New-1etFirewallRule -DisplayName "Limit ICMP" -Protocol ICMPv4 -Action Block -RemoteAddress Any -Direction Inbound -LimitIcmpAttackThreshold 10
7. Training Course Recommendations for Network & Security Engineers
Based on the original post author’s expertise (Cisco, Palo Alto, Fortinet, Avigilon), the following hands‑on courses reinforce latency/throughput/bandwidth skills:
– Cisco CCNA (200-301): Chapters on QoS, network metrics, and troubleshooting.
– Palo Alto PCNSA/PCNSE: Firewall policies for bandwidth shaping and App‑ID inspection.
– Fortinet NSE 4: Traffic shaping, SD‑WAN, and link monitoring.
– Wireshark TCP/IP Analysis (by Chris Greer): Deep dive into retransmissions and latency.
– Cloud Networking Specialization (AWS/Azure): Hands‑on labs for monitoring and optimization.
Telegram resource: For ongoing updates and tools, follow the channel linked in the original post: https://lnkd.in/dk_ev_gb
What Undercode Say:
– Key Takeaway 1: Latency, throughput, and bandwidth are not interchangeable—mixing them up leads to wasted time and misconfigured security policies. Always start with latency for interactive apps, throughput for bulk data, and bandwidth for capacity planning.
– Key Takeaway 2: Command‑line tools (ping, iperf3, iftop) plus packet analysis (Wireshark) give you the visibility to pinpoint the real bottleneck. Don’t guess; measure each metric in isolation before changing firewall rules or upgrading circuits.
Analysis (10 lines): The original LinkedIn post provides a crisp, foundational explanation that too many engineers gloss over. In cybersecurity, misdiagnosing a slow application as a “firewall issue” often results in rule flailing, when a simple ping would reveal 200 ms of latency. Conversely, blaming latency for failed multi‑TB backups ignores that throughput is the actual constraint. This article expands those basics into actionable, platform‑specific commands—covering Linux, Windows, and cloud APIs—so that readers can immediately validate each metric. The inclusion of attack vectors (slow‑loris, side‑channels) shows how adversaries weaponize these same metrics. For defenders, understanding normal vs. anomalous latency patterns is now a core detection capability. The training recommendations bridge theory to certification. Ultimately, mastering these three metrics transforms reactive troubleshooting into proactive network hardening.
Prediction:
– +1 AI‑driven network observability platforms will soon automate latency/throughput correlation, flagging anomalies without manual iperf3 runs.
– +1 SASE and SD‑WAN adoption will make bandwidth‑aware security policies (e.g., drop non‑critical traffic during saturation) a standard feature in all major firewalls.
– -1 Attackers will increasingly use latency side‑channels to exfiltrate data from air‑gapped networks via covert timing signals.
– -1 As 5G and edge computing expand, misconfigured bandwidth quotas will cause unexpected “bill shock” DDoS, where attackers drive up cloud egress costs.
– +1 Open‑source tools like eBPF will enable real‑time per‑packet latency measurements inside the kernel, reducing the need for intrusive probes.
▶️ Related Video (78% Match):
🎯Let’s Practice For Free:
🎓 Live Courses & Certifications:
[Join Undercode Academy for Verified Certifications](https://undercode.co.uk/certifications/)
🚀 Request a Custom Project:
Secure, high-velocity infrastructure and disruptive technological engineering. Contact our engineering team for high-tier development and proprietary systems:
[[email protected]](mailto:[email protected])
💎 Smart Architecture | 🛡️ Secure by Design | ⭐ Trusted by Thousands
IT/Security Reporter URL:
Reported By: [Mohamed Abdelgadr](https://www.linkedin.com/posts/mohamed-abdelgadr-a9928b1a1_latency-vs-throughput-vs-bandwidth-one-thing-share-7468698069740703744-_TTq/) – Hackers Feeds
Extra Hub: Undercode MoN
Basic Verification: Pass ✅
🔐JOIN OUR CYBER WORLD [ CVE News • HackMonitor • UndercodeNews ]
[💬 Whatsapp](https://undercode.help/whatsapp) | [💬 Telegram](https://t.me/UndercodeCommunity)
📢 Follow UndercodeTesting & Stay Tuned:
[𝕏 formerly Twitter 🐦](https://x.com/undercodeupdate) | [@ Threads](https://www.threads.net/@undercodetesting) | [🔗 Linkedin](https://www.linkedin.com/company/undercodetesting/) | [🦋BlueSky](https://bsky.app/profile/undercode.bsky.social)


