Listen to this Post
Introduction
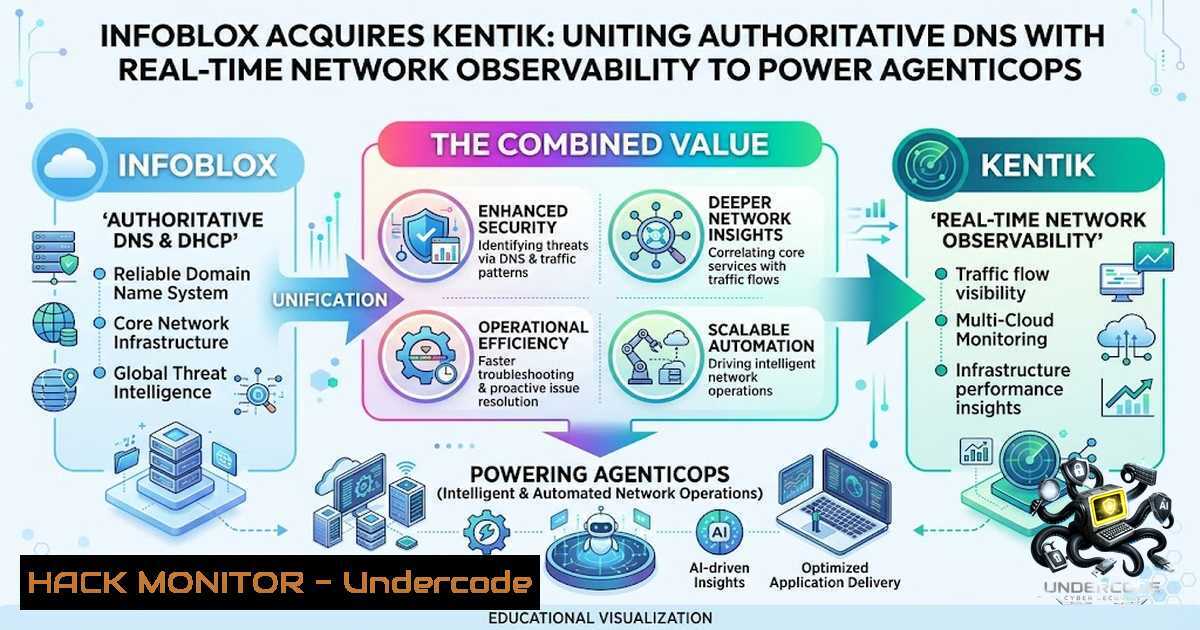
On July 8, 2026, Infoblox announced a definitive agreement to acquire Kentik, a leading network intelligence and observability platform. This strategic merger combines Infoblox’s authoritative DNS, DHCP, and IP address management (DDI) with Kentik’s real-time network traffic intelligence, creating a unified operational data fabric for hybrid and multi-cloud environments. The acquisition addresses a critical gap in modern IT operations: the disconnect between how networks are configured and how they actually behave in motion.
Learning Objectives
- Understand the technical capabilities and synergies between Infoblox’s DDI platform and Kentik’s network observability tools
- Learn how to leverage AI-driven network intelligence for security operations and threat detection
- Master practical commands and configurations for DNS security, flow analysis, and network troubleshooting
You Should Know
- Understanding the Technology Stack: Infoblox DDI and Kentik Observability
Infoblox has spent over two decades managing the DNS, DHCP, and IPAM services that enterprises rely on to stay connected. Its Universal DDI platform provides a unified, cloud-based control plane for managing these core network services across hybrid and multi-cloud environments. Kentik, founded in 2014 by Avi Freedman, Ian Pye, Ian Applegate, and Justin Biegel, ingests full-fidelity flow data, routing and path intelligence, cloud VPC logs, synthetic testing, and device telemetry across data centers, cloud environments, WANs, and the public internet.
What this means for practitioners: The combined platform creates an “authoritative network data layer”—a single source of truth that connects what is configured (Infoblox) with how traffic actually behaves (Kentik). This eliminates the blind spots that occur when networking, security, and cloud operations teams manage infrastructure through disconnected tools and siloed data.
Key Linux/Windows Commands for DDI and Network Observability:
Linux – DNS Query and Analysis:
 Perform a DNS lookup with detailed output
dig +trace example.com

Query specific DNS record types
nslookup -type=MX example.com

Analyze DNS traffic with tcpdump
sudo tcpdump -i eth0 -1 port 53 -v

Check DNS cache status (systemd-resolved)
sudo resolvectl statistics
Windows – DNS and Network Diagnostics:
 Flush DNS cache
ipconfig /flushdns

Display DNS resolver cache
ipconfig /displaydns

Perform DNS lookup
Resolve-DnsName -1ame example.com -Type A

Test network connectivity with path tracing
Test-1etConnection -ComputerName example.com -TraceRoute
Flow Analysis (Kentik-style):
 Collect sFlow/netFlow data using nfdump
nfdump -R /path/to/flows -1 -o "fmt:%ts,%td,%sa,%da,%sp,%dp,%pr,%byt"

Analyze BGP routing data
vtysh -c "show bgp summary"
vtysh -c "show bgp ipv4 unicast"

Monitor network performance with synthetic testing
ping -c 10 -i 0.5 8.8.8.8
mtr -r -c 100 8.8.8.8
- AI-Driven Threat Defense with Infoblox IQ and Kentik AI
Infoblox has already launched Infoblox IQ, an agentic AI operations layer for network and security teams. For security operations, Infoblox IQ helps reduce alert fatigue by automatically correlating threats, assets, users, devices, and network activity into a clear investigation path. Kentik complements this with its AI Advisor, which acts as a “Network Intelligence partner” capable of tracing network paths, identifying cost-saving opportunities, and providing natural language troubleshooting.
Step-by-Step: Configuring DNS Threat Intelligence
1. Enable DNS Security Logging on Infoblox NIOS:
- Navigate to Grid → Members → Select your NIOS appliance
- Go to DNS → Logging → Enable “Query Logging”
- Configure log destination to Syslog server or external SIEM
- Configure DNS Response Policy Zones (RPZ) for Threat Blocking:
On Infoblox NIOS CLI (or via WebUI)
Create a RPZ zone for malicious domain blocking
nios-cli -c "add zone _rpz.example.com zone_type=RPZ"
nios-cli -c "add record:rpz _rpz.example.com trigger=malware.com action=NoData"
3. Integrate Kentik Flow Data with Threat Intelligence:
 Configure Kentik Universal Agent for flow collection
 /etc/kentik/kentik.conf
[bash]
api_host = api.kentik.com
api_email = [email protected]
api_token = your-api-token
flow_sources = /var/log/flow/.cap

Enable syslog observability (Kentik)
 In Universal Agent config, enable:
syslog_enabled = true
syslog_listen_port = 514
4. Query DNS Logs for Threat Hunting:
 On Infoblox, extract DNS query logs
 Using REST API
curl -X GET "https://<infoblox-grid>/wapi/v2.11/log:dns" \
-H "Authorization: Basic <base64-credentials>" \
-H "Content-Type: application/json"
3. Network Observability for Hybrid and Multi-Cloud Environments
Kentik provides real-time visibility across networks, applications, and cloud environments. The platform ingests flow data, routing intelligence, and device telemetry from diverse sources. With this acquisition, Infoblox gains the ability to see “who is talking to who” across the network—a capability previously missing from its authoritative view of “what is on the network”.
Step-by-Step: Setting Up Hybrid Cloud Observability
1. Deploy Kentik Universal Agent for Multi-Source Telemetry:
 Install Kentik Universal Agent (Linux)
wget -O /tmp/kentik-agent-install.sh https://agent.kentik.com/install.sh
sudo bash /tmp/kentik-agent-install.sh \
--email [email protected] \
--api-token your-token \
--company-id your-company-id

Verify agent status
sudo systemctl status kentik-agent
sudo kentik-agent --version
2. Configure Cloud VPC Flow Logs (AWS Example):
 Enable VPC Flow Logs via AWS CLI
aws ec2 create-flow-logs \
--resource-ids vpc-12345678 \
--resource-type VPC \
--traffic-type ALL \
--log-destination-type cloud-watch-logs \
--log-destination-arn arn:aws:logs:region:account:log-group:flow-logs

Stream to Kentik via S3 or Kinesis
 Configure in Kentik portal: Settings → Data Sources → AWS
3. Enable BGP Telemetry for Path Intelligence:
 On Cisco IOS-XE routers
configure terminal
bgp telemetry enable
bgp telemetry destination <kentik-collector-ip> port 50051
end

On Juniper MX
set protocols bgp group internal telemetry export <kentik-collector>
set protocols bgp group internal telemetry path-computation
4. Create Synthetic Tests for Proactive Monitoring:
 Using Kentik API to create synthetic test
curl -X POST "https://api.kentik.com/api/v1/synthetics/tests" \
-H "X-CH-Auth-Email: [email protected]" \
-H "X-CH-Auth-API-Token: your-token" \
-H "Content-Type: application/json" \
-d '{
"name": "Critical-API-Monitor",
"type": "http",
"target": "https://api.company.com/health",
"interval": 60,
"locations": ["us-east-1", "eu-west-1", "ap-southeast-1"]
}'
4. Automating Security Investigations with Agentic AI
The combination of Infoblox’s DNS security intelligence and Kentik’s network observability enables automated threat investigation. Infoblox IQ for Threat Defense agentically investigates DNS security alerts, collecting evidence, analyzing activity, and determining root cause. Kentik’s AI Advisor can correlate synthetics monitoring with real-time BGP telemetry to identify root causes.
Step-by-Step: Building Automated Security Playbooks
1. Configure Infoblox IQ for Automated Threat Response:
 Python script using Infoblox REST API for automated threat blocking
import requests
import json

infoblox_url = "https://<infoblox-grid>/wapi/v2.11"
headers = {"Authorization": "Basic <credentials>"}

def block_malicious_domain(domain):
payload = {
"name": domain,
"view": "default",
"rpz_zone": "_rpz.company.com",
"rpz_action": "NoData"
}
response = requests.post(
f"{infoblox_url}/record:rpz",
headers=headers,
data=json.dumps(payload)
)
return response.status_code == 201
- Integrate Kentik AI Advisor for Root Cause Analysis:
Query Kentik AI Advisor via REST API
curl -X POST "https://api.kentik.com/api/v1/ai/advisor/query" \
-H "X-CH-Auth-Email: [email protected]" \
-H "X-CH-Auth-API-Token: your-token" \
-H "Content-Type: application/json" \
-d '{
"query": "Analyze the latest packet loss spike in us-east-1 region",
"time_range": "last_1h"
}'
3. Create SIEM Integration for Correlated Alerts:
 Example: Forward Infoblox DNS security alerts to Splunk
 Configure syslog-1g on Infoblox
destination d_splunk {
tcp("splunk-heavy-forwarder.company.com" port(514));
};
log {
source(s_dns_security);
destination(d_splunk);
};
5. Operationalizing Network Truth for Agentic Operations
Infoblox and Kentik close the gap between understanding how the network is configured and its real behavior in motion. This creates an “authoritative network data layer” that accelerates an enterprise’s move to agentic operations—where AI systems can autonomously manage, troubleshoot, and optimize network infrastructure.
Step-by-Step: Validating Network Configuration vs. Reality
1. Compare DNS Configuration with Observed Traffic:
 Extract DNS zone data from Infoblox
curl -X GET "https://<infoblox-grid>/wapi/v2.11/zone_auth" \
-H "Authorization: Basic <credentials>" \
| jq '.[] | {name: .fqdn, view: .view}'

Compare with observed DNS queries from Kentik flow data
 Using Kentik API to query DNS query volume
curl -X GET "https://api.kentik.com/api/v1/query/dns" \
-H "X-CH-Auth-Email: [email protected]" \
-H "X-CH-Auth-API-Token: your-token" \
-H "Content-Type: application/json" \
-d '{"time_range": "last_24h", "group_by": ["dns_query"]}'
2. Detect Shadow IT and Rogue Devices:
 Query Infoblox IPAM for all registered devices
curl -X GET "https://<infoblox-grid>/wapi/v2.11/ipv4address" \
-H "Authorization: Basic <credentials>" \
| jq '.[] | {ip: .ip_address, mac: .mac, host: .names}'

Query Kentik for all active IPs observed in traffic
curl -X GET "https://api.kentik.com/api/v1/query/top" \
-H "X-CH-Auth-Email: [email protected]" \
-H "X-CH-Auth-API-Token: your-token" \
-d '{"metric": "flows", "group_by": ["dst_ip"], "limit": 1000}'

Use awk to compare and identify mismatches
comm -23 <(kentik_ips | sort) <(infoblox_ips | sort) > shadow_ips.txt
What Undercode Say
- Unified Data Fabric is the Game Changer: The integration creates a single, AI-ready operational data fabric that combines authoritative network identity with real-time traffic intelligence. This eliminates the manual stitching together of fragmented data sources that has traditionally slowed incident response.
-
AgenticOps Requires Trusted Data: As AI takes on greater responsibility in network operations, the quality and completeness of the data it acts on becomes mission-critical. This acquisition directly addresses the data quality challenge by providing a validated, authoritative view of network reality.
-
Security and Networking Convergence: The merger reflects the growing interdependence of networking and security teams. By combining Infoblox’s DNS-based security intelligence with Kentik’s traffic visibility, organizations can now answer the fundamental questions: “What’s on my network? Where is traffic actually going? Is it safe?”
-
Automation at Scale: With Infoblox IQ’s agentic AI capabilities and Kentik’s AI Advisor, the platform can autonomously investigate alerts, correlate events, and suggest remediation. This represents a significant step toward reducing Mean Time to Detect (MTTD) and Mean Time to Respond (MTTR).
-
Practical Implications for Practitioners: Network and security engineers must now develop skills across both DDI management and network observability. Familiarity with flow analysis, BGP telemetry, and AI-driven investigation tools will become essential. The ability to write automation scripts that leverage REST APIs from both platforms will be highly valued.
Prediction
-
+1 Accelerated AI Adoption in Network Operations: The unified platform will accelerate enterprise adoption of AI-driven network operations, reducing the reliance on manual troubleshooting and enabling self-healing infrastructures.
-
+1 Enhanced Cyber Resilience: Organizations will achieve better cyber resilience through correlated DNS security intelligence and real-time traffic visibility, enabling faster detection and containment of threats.
-
+1 Reduced Operational Complexity: The single-pane-of-glass approach will simplify hybrid and multi-cloud operations, reducing the tool sprawl that currently plagues many IT organizations.
-
-1 Integration Challenges: The complexity of integrating two mature platforms may lead to initial implementation challenges and require significant professional services investment.
-
+1 New Career Opportunities: The merger will create demand for professionals skilled in both DDI management and network observability, particularly those with AI/ML operations experience.
-
-1 Vendor Lock-in Concerns: Organizations heavily invested in Infoblox may face increased vendor lock-in as the combined platform offers more comprehensive capabilities, potentially limiting multi-vendor strategies.
▶️ Related Video (82% Match):
https://www.youtube.com/watch?v=1VNtPpsCQfc
🎯Let’s Practice For Free:
🎓 Live Courses & Certifications:
Join Undercode Academy for Verified Certifications
🚀 Request a Custom Project:
Secure, high-velocity infrastructure and disruptive technological engineering. Contact our engineering team for high-tier development and proprietary systems:
[email protected]
💎 Smart Architecture | 🛡️ Secure by Design | ⭐ Trusted by Thousands
IT/Security Reporter URL:
Reported By: Acquisition Cybersecurity – Hackers Feeds
Extra Hub: Undercode MoN
Basic Verification: Pass ✅


