Listen to this Post
Introduction:
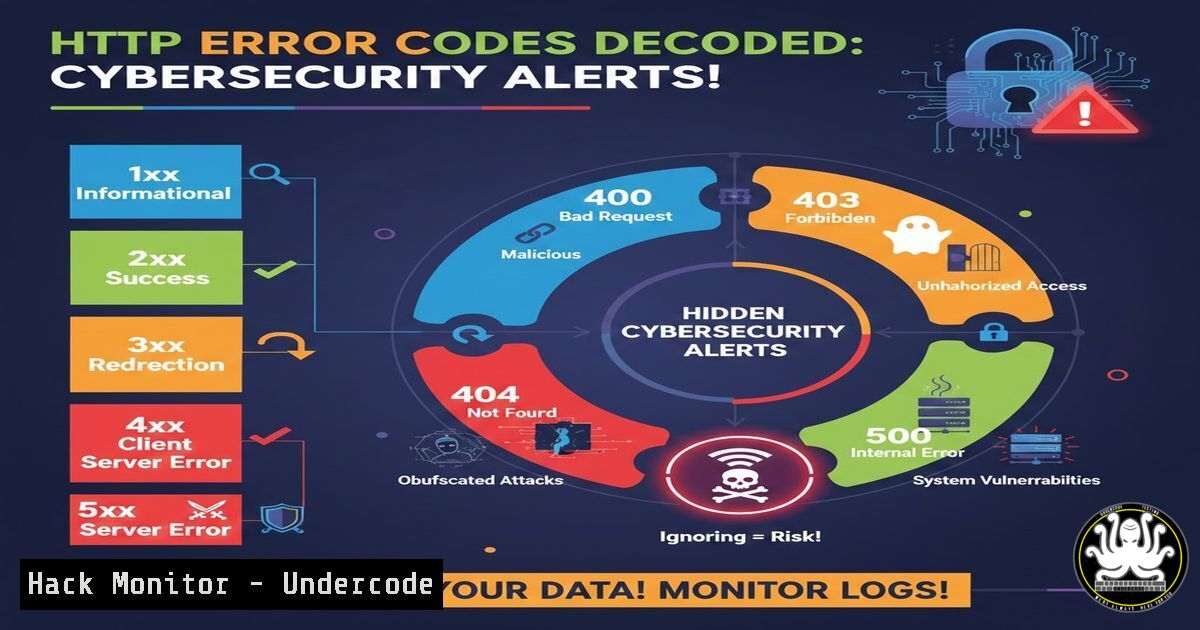
HTTP status codes are far more than simple error messages; they are a critical diagnostic language for your web infrastructure and a frontline indicator of security posture. For IT professionals, developers, and cybersecurity practitioners, correctly interpreting these codes can mean the difference between quickly resolving a misconfiguration and leaving a critical vulnerability wide open. This guide transforms generic troubleshooting into a structured security and operations protocol.
Learning Objectives:
- Decode common HTTP error codes from both a functional and security perspective.
- Execute advanced diagnostic commands on Linux and Windows servers to pinpoint root causes.
- Implement corrective actions and hardening measures to mitigate risks exposed by these errors.
You Should Know:
- The Client-Side Quadrant: 4xx Errors as Access Control Signals
While often dismissed as user errors, 4xx codes frequently reveal misconfigured security boundaries and potential attack surface mapping.400 Bad Request: This can signal malformed attack payloads (e.g., SQL injection attempts with broken syntax) or misconfigured security tools like Web Application Firewalls (WAFs). Use logging to investigate.
Linux CLI Log Analysis: `sudo tail -f /var/log/nginx/access.log | grep ” 400 “` or `sudo journalctl -u apache2 -f | grep 400`
Windows (PowerShell): `Get-Content -Path ‘C:\inetpub\logs\LogFiles\W3SVC1\u_ex.log' -Tail 100 | Select-String " 400 "` 401 Unauthorized & 403 Forbidden: The critical distinction. A 401 means authentication is possible but missing/failed. A 403 means the server knows who you are but denies authorization. Troubleshooting 401: Verify auth headers. Test with <code>curl</code>: `curl -I -H "Authorization: Bearer <TOKEN>" http://your-api.com/endpoint` Troubleshooting 403: Check filesystem permissions. On Linux: `ls -la /var/www/html/restricted_file`. On Windows, verify NTFS permissions. This error can also indicate successful login but privilege escalation failure, a key finding in penetration tests. 429 Too Many Requests: A direct signal of rate limiting in action, crucial for mitigating brute-force attacks. Configure in Nginx: `limit_req_zone $binary_remote_addr zone=one:10m rate=10r/s;` then apply to location block: `limit_req zone=one burst=20 nodelay;` Configure in Apache (mod_evasive): Install and configure mod_evasive to throttle excessive requests from a single IP.</p></li> </ol> <h2 style="color: yellow;">2. Server-Side Failures: 5xx Errors and Infrastructure Vulnerability</h2> <p>5xx errors indicate server failures, which can be goldmines for attackers seeking to disrupt services or exploit unstable conditions. 500 Internal Server Error: A catch-all that often exposes underlying code flaws or resource issues. Always check application logs first. <h2 style="color: yellow;"> Enable Detailed Logging:</h2> <h2 style="color: yellow;"> PHP: `error_reporting(E_ALL); ini_set('display_errors', 0); ini_set('log_errors', 1);`</h2> Django: `DEBUG = False` and configure `LOGGING` in settings.py. General Linux Log: `sudo tail -f /var/log/syslog` or `/var/log/messages` 502 Bad Gateway / 504 Gateway Timeout: These point to failures in proxy or backend services, which can be exploited in DoS conditions or to target internal services. Diagnose Upstreams (Nginx): Check the upstream server status: `sudo systemctl status php-fpm` or <code>sudo systemctl status your_backend_service</code>. Network Connectivity Test: From the proxy server, test connectivity to the upstream: `curl -v http://upstream-server:port`. Check for firewall rules: `sudo iptables -L -n -v<code>(Linux) or `Get-NetFirewallRule` (Windows PowerShell). Adjust Timeouts (Nginx): In config: `proxy_read_timeout 300s; proxy_connect_timeout 75s;` <h2 style="color: yellow;">3. The Visibility Gap: 404s and Information Leakage</h2> A 404 should not reveal unnecessary system details. Generic errors prevent attackers from enumerating valid resources. Secure Your 404s: Ensure your custom 404 page does not leak framework versions, server paths, or stack traces. Scan for Sensitive 404s: Use a tool like `gobuster` or `dirb` to find hidden paths, but also to audit what your own site leaks: `gobuster dir -u https://yoursite.com -w /usr/share/wordlists/common.txt -x php,html,txt` <h2 style="color: yellow;">4. Proactive Monitoring: Transforming Errors into Alerts</h2> <h2 style="color: yellow;">Passive troubleshooting is insufficient. Implement active monitoring.</h2> Linux (Using `logwatch` or</code>fail2ban`): Configure `fail2ban` to monitor logs for patterns of 401/403/429 errors and temporarily ban offending IPs. Cloud (AWS CloudWatch / Azure Monitor): Create metric filters and alarms for spikes in 5xx errors, triggering SNS notifications or Lambda functions for auto-remediation. <ol> <li>API Security: Error Codes as Part of Your Security Specification APIs must return standardized, non-leaky errors. A 401 should include a proper `WWW-Authenticate` header, not a stack trace.</li> </ol> <h2 style="color: yellow;"> Secure API Error Response Example (JSON):</h2> [bash] { "error": { "code": "unauthorized", "message": "Invalid or expired authentication token.", "target": "header.authorization" } }Avoid detailed internal errors in production API responses.
What Undercode Say:
- Key Takeaway 1: HTTP errors are not endpoints for troubleshooting but starting points for security and performance audits. Each code, especially 4xx series, maps directly to a layer of your access control and input validation defenses.
- Key Takeaway 2: The diagnostic path for resolving these errors (log analysis, permission checks, upstream health verification) is the same workflow used by attackers to map and exploit your infrastructure. By mastering it defensively, you close the gaps they seek.
The analysis here reframes standard IT support knowledge through a security lens. A 403 isn’t just a “permissions issue”; it’s a confirmation that your authorization layer is working. A spike in 400 errors might indicate a fuzzing attack. The tools and commands provided move the user from clearing their browser cache to conducting server-level forensics, which is where true operational security is enforced. This approach transforms reactive support into proactive infrastructure hardening.
Prediction:
The future of error code management lies in AI-driven anomaly detection and automated response. Machine learning models will baseline normal error distributions (e.g., typical 404 rate for a site) and flag deviations in real-time, correlating them with threat intelligence feeds to distinguish between a casual typo and a targeted directory busting attack. Furthermore, we will see deeper integration between error code analytics and DevSecOps pipelines, where specific 5xx patterns automatically trigger rollbacks, scale resources, or create security tickets, making system resilience and security increasingly autonomous and predictive.
▶️ Related Video (86% Match):
🎯Let’s Practice For Free:
IT/Security Reporter URL:
Reported By: Mosesmedh Error – Hackers Feeds
Extra Hub: Undercode MoN
Basic Verification: Pass ✅🔐JOIN OUR CYBER WORLD [ CVE News • HackMonitor • UndercodeNews ]
📢 Follow UndercodeTesting & Stay Tuned:


