Listen to this Post
Introduction
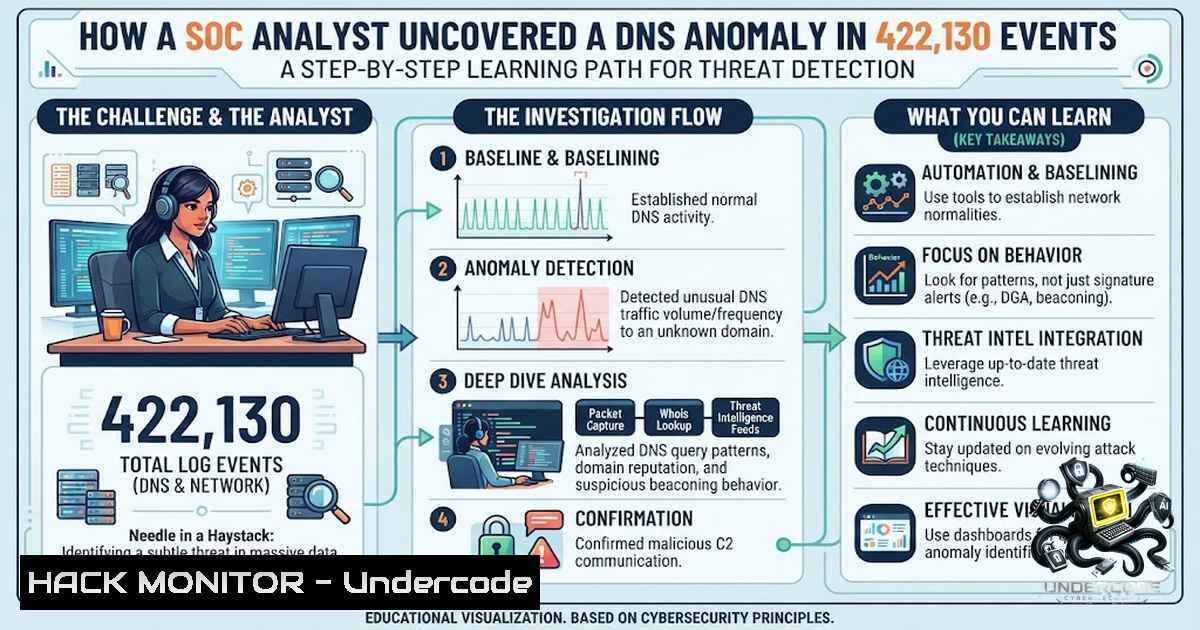
DNS is the phonebook of the internet, but for security analysts, it is also one of the most prolific early-warning systems. Attackers often misuse DNS for command-and-control (C2) communications, data exfiltration, or reconnaissance long before traditional perimeter defenses trigger an alert. A recent hands-on Splunk lab analyzing 422,130 DNS events across a 24-hour window demonstrates exactly how tier-1 SOC analysts can cut through the noise, pinpoint suspicious patterns, and build the muscle memory required for effective threat detection.
Learning Objectives
- Objective 1: Master the “baseline → narrow → attribute → validate” investigation funnel for DNS log analysis.
- Objective 2: Learn to identify anomalous DNS query patterns—including high-volume single-source spikes and low-and-slow domain variants.
- Objective 3: Gain practical Splunk search syntax, Linux/Windows command-line utilities, and risk-scoring techniques to enrich your SOC workflows.
You Should Know
1. Baselining the Environment—Know What “Normal” Looks Like
Before you can spot an anomaly, you must understand your environment’s regular DNS behavior. In the lab, the analyst began by surfacing 5,149 unique domains queried over 24 hours. This initial count provides a crucial reference point: a sudden 50% increase in unique domains could indicate DNS tunneling or domain-generation algorithm (DGA) activity.
Step‑by‑Step Guide – Building Your DNS Baseline in Splunk:
1. Identify Total Query Volume
`index=dns sourcetype=dns earliest=-24h | stats count`
Expected output: Total event count (e.g., 422,130).
2. Enumerate Unique Domains
`index=dns sourcetype=dns earliest=-24h | stats dc(domain) as unique_domains`
Why: A baseline of 5,149 unique domains is your anchor.
3. Map Query Volume by Domain
`index=dns sourcetype=dns earliest=-24h | top 30 domain`
Action: Review the top 30 highest-volume domains. Separate legitimate infrastructure (e.g., CDNs, cloud metadata endpoints) from suspicious entries.
4. Flag Known Abusable Protocols
Pay special attention to WPAD and ISATAP queries—both have a documented history of spoofing and relay abuse.
Linux Command-Line Equivalent (for local pcap or logs):
 Extract unique domains from a DNS log file
cat dns.log | awk '{print $5}' | sort | uniq -c | sort -1r | head -30

Count total DNS queries
wc -l dns.log
Windows PowerShell Equivalent:
 Count unique domains from a CSV export
Import-Csv .\dns_logs.csv | Group-Object Domain | Sort-Object Count -Descending | Select-Object -First 30

Get total event count
(Import-Csv .\dns_logs.csv).Count
2. Narrowing the Focus—From Noise to Notable
Once the baseline is established, the next step is narrowing to the top 30 highest-volume domains. This is where signal begins to separate from noise. In the lab, one domain—tools.google.com—stood out because a single source IP accounted for 72% of all queries to that domain. Such concentration is a classic red flag: it suggests either a misconfigured application, a compromised host repeatedly phoning home, or a beaconing mechanism.
Step‑by‑Step Guide – Isolating Anomalous Source IPs:
1. Filter by Target Domain
`index=dns domain=tools.google.com | stats count by src_ip | sort – count`
2. Calculate Percentage of Total Queries
index=dns domain=tools.google.com
| eventstats count as total_queries
| stats count by src_ip
| eval percentage = round(count / total_queries  100, 2)
| sort - percentage
3. Correlate with Threat Intelligence
Use a lookup (e.g., | lookup threat_intel.csv ip as src_ip OUTPUT threat_level) to enrich the source IP with known reputation scores.
4. Check for Beaconing Patterns
`index=dns domain=tools.google.com src_ip=10.0.0.5 | timechart span=5m count`
Look for: Regular spikes every 5–10 minutes—a classic C2 beaconing signature.
Linux Tool – `tshark` for Real-Time DNS Analysis:
 Capture DNS queries and show top talkers
tshark -r capture.pcap -Y "dns.flags.response == 0" -T fields -e ip.src -e dns.qry.name | sort | uniq -c | sort -1r | head -30
Windows Tool – `nslookup` Debugging:
 Query a specific domain and check response codes
nslookup -debug tools.google.com
3. Attributing Traffic—Tracing Back to the Source
Attribution is where raw data transforms into actionable intelligence. The analyst traced `tools.google.com` traffic back to the source IP and validated the finding against raw event data—query types, response codes (NXDOMAIN, REFUSED), and timestamps. This validation step is non-1egotiable: a high-volume source might simply be a build server running automated updates, but it could also be a malware sample using Google’s infrastructure as a dead-drop resolver.
Step‑by‑Step Guide – Validating and Attributing:
1. Examine Query Types
`index=dns domain=tools.google.com src_ip=10.0.0.5 | stats count by query_type`
If you see predominantly `TXT` or `NULL` queries, suspect DNS tunneling.
2. Review Response Codes
`index=dns domain=tools.google.com src_ip=10.0.0.5 | stats count by response_code`
- NXDOMAIN → Possible DGA or typo-squatting.
- REFUSED → Potential DNS amplification attack or misconfigured resolver.
3. Timestamp Analysis
`index=dns domain=tools.google.com src_ip=10.0.0.5 | table _time, query_type, response_code, domain`
Look for: Queries occurring outside normal business hours—a strong indicator of automated malicious activity.
Splunk Macro for Rapid Attribution:
`dns_attribution(domain=tools.google.com, src_ip=10.0.0.5, timespan=24h)`
Create this macro to standardize your team’s investigation process.
4. The Low-and-Slow Threat—Why It’s Harder to Spot
The post poses a critical question: “What’s more likely to slip past a SOC team unnoticed: a single high-volume DNS query pattern, or a slow, low-and-slow trickle spread across hundreds of domains?” The answer is the latter. High-volume spikes trigger alarms; low-and-slow activity mimics legitimate background noise, evading threshold-based alerts.
Step‑by‑Step Guide – Detecting Low-and-Slow DNS Exfiltration:
1. Calculate Baseline per Domain
`index=dns earliest=-30d | stats avg(count) as avg_queries, stdev(count) as std_queries by domain`
2. Identify Gradual Increases
index=dns earliest=-7d
| stats count by domain, date_wday
| eventstats avg(count) as weekly_avg by domain
| where count > weekly_avg  1.5
3. Look for Rare Domains with Consistent Queries
`index=dns | stats count by domain | where count < 50 AND count > 5`
This range often captures low-volume C2 channels.
4. Entropy-Based Detection
Use a custom search to flag domains with high entropy (e.g., `dns.qry.name` matching [a-z0-9]{20,}\.com)—a hallmark of DGA.
Linux Command – Entropy Check:
 Calculate entropy of domain names in a log file
cat dns.log | awk '{print $5}' | while read domain; do echo -1 "$domain: "; echo $domain | grep -o . | sort | uniq -c | awk '{sum+=$1; n++} END {if(n>0) print -sum/nlog(sum/n)/log(2)}'; done
Windows PowerShell – Rare Domain Detection:
Import-Csv .\dns_logs.csv | Group-Object Domain | Where-Object { $<em>.Count -lt 50 -and $</em>.Count -gt 5 } | Sort-Object Count
5. Hardening DNS Infrastructure Against Abuse
Detection is only half the battle; prevention and mitigation complete the SOC loop. Based on the lab findings, several hardening measures can reduce the attack surface:
Step‑by‑Step Guide – DNS Hardening:
1. Restrict Recursive Resolvers
- On Windows Server: Open DNS Manager → Properties → Interfaces → “Only the following IP addresses”.
- On Linux (BIND): Edit `/etc/named.conf` and add
allow-query { internal_subnets; };.
2. Enable DNSSEC
– `dnssec-enable yes;` in BIND.
– On Windows: DNS Manager → Properties → DNSSEC → Enable.
3. Block Known Malicious Domains
- Use Splunk to feed threat intelligence into a blocklist:
`| inputlookup threat_domains.csv | outputlookup blocklist.csv`
- Then apply via Windows DNS Policy or Linux `dnsmasq` with
address=/malicious.com/0.0.0.0.
4. Monitor for NXDOMAIN Floods
- Create a Splunk alert:
`index=dns response_code=NXDOMAIN | stats count by src_ip | where count > 1000` - This may indicate a DNS reflection attack or a misconfigured client.
Linux Firewall Rule – Rate-Limit DNS Queries:
 Limit incoming DNS queries to 10 per second per IP
iptables -A INPUT -p udp --dport 53 -m state --state NEW -m recent --set
iptables -A INPUT -p udp --dport 53 -m state --state NEW -m recent --update --seconds 1 --hitcount 10 -j DROP
- API Security and Cloud Hardening in the DNS Context
Modern DNS logs often include cloud-1ative metadata. Integrating API security and cloud hardening into your DNS analysis adds a powerful layer of defense.
Step‑by‑Step Guide – Enriching DNS with Cloud Context:
1. Pull AWS Route 53 Logs into Splunk
Configure AWS S3 export and use the Splunk Add-on for AWS.
2. Correlate with VPC Flow Logs
`index=aws_vpcflow | join src_ip [search index=dns domain=tools.google.com]`
This maps DNS queries to network traffic, confirming whether the query led to an actual connection.
3. API Key Exposure Check
Use Splunk to search for API keys in DNS query strings (e.g., api_key=):
`index=dns | regex domain=”api_key=[A-Za-z0-9]{32}”`
4. Cloud IAM Hardening
- Restrict DNS resolution to specific VPCs using AWS Route 53 Resolver rules.
- On Azure, use Azure DNS Private Resolver with conditional forwarding policies.
Azure CLI – Restrict DNS Forwarding:
az network dns forward-ruleset create --1ame MyRuleset --resource-group MyRG --location eastus
az network dns forwarding-rule create --ruleset-1ame MyRuleset --1ame BlockMalicious --domain-1ame "malicious.com" --target-dns-servers "0.0.0.0"
What Undercode Say
- Key Takeaway 1: The “baseline → narrow → attribute → validate” funnel is a universal SOC pattern that applies to any log source—not just DNS. Master it, and you can pivot to firewall, proxy, or endpoint logs with minimal retraining.
-
Key Takeaway 2: High-volume spikes are noisy and often caught; low-and-slow threats that spread queries across hundreds of domains are far more dangerous because they evade threshold-based alerts. SOC teams must build behavioral baselines and use statistical deviation (e.g., standard deviation, entropy) to catch these subtle patterns.
Analysis: The lab’s methodology reflects a disciplined, repeatable process that separates junior analysts from seasoned investigators. By documenting each step—from counting unique domains to validating response codes—the practitioner builds a reusable knowledge base. The emphasis on raw event validation (not just aggregated stats) is critical: false positives in DNS can waste hours if not grounded in actual packet-level evidence. Moreover, the discussion of WPAD and ISATAP abuse highlights how legacy protocols continue to haunt modern networks. SOC teams should treat these as canaries in the coal mine: if you see them in your top-30 list, investigate immediately. Finally, the question posed about low-and-slow attacks is a perfect interview-style prompt; it forces analysts to think beyond “alert fatigue” and embrace anomaly detection as a core competency.
Prediction
- +1 Over the next 12–18 months, SIEM platforms will increasingly embed machine-learning-based behavioral baselines that automatically flag deviations from established DNS query patterns, reducing the manual baseline effort described in this lab.
-
+1 The integration of DNS logs with cloud-1ative threat intelligence feeds (e.g., AWS GuardDuty, Azure Threat Intelligence) will become standard, enabling real‑time attribution without requiring separate enrichment lookups.
-
-1 The rise of encrypted DNS (DoH/DoT) will continue to blind traditional network-based detection, forcing SOC teams to rely more heavily on endpoint telemetry and proxy logs—shifting the detection burden but not eliminating the need for DNS expertise.
-
-1 Low-and-slow DNS exfiltration techniques will become more sophisticated, using legitimate cloud domains (e.g.,
azure.com,amazonaws.com) as cover, making it increasingly difficult to distinguish benign from malicious traffic without deep packet inspection and behavioral analytics.
▶️ Related Video (72% Match):
https://www.youtube.com/watch?v=56NDgBOSpUg
🎯Let’s Practice For Free:
🎓 Live Courses & Certifications:
Join Undercode Academy for Verified Certifications
🚀 Request a Custom Project:
Secure, high-velocity infrastructure and disruptive technological engineering. Contact our engineering team for high-tier development and proprietary systems:
[email protected]
💎 Smart Architecture | 🛡️ Secure by Design | ⭐ Trusted by Thousands
IT/Security Reporter URL:
Reported By: Taufik Sumara – Hackers Feeds
Extra Hub: Undercode MoN
Basic Verification: Pass ✅


