Listen to this Post
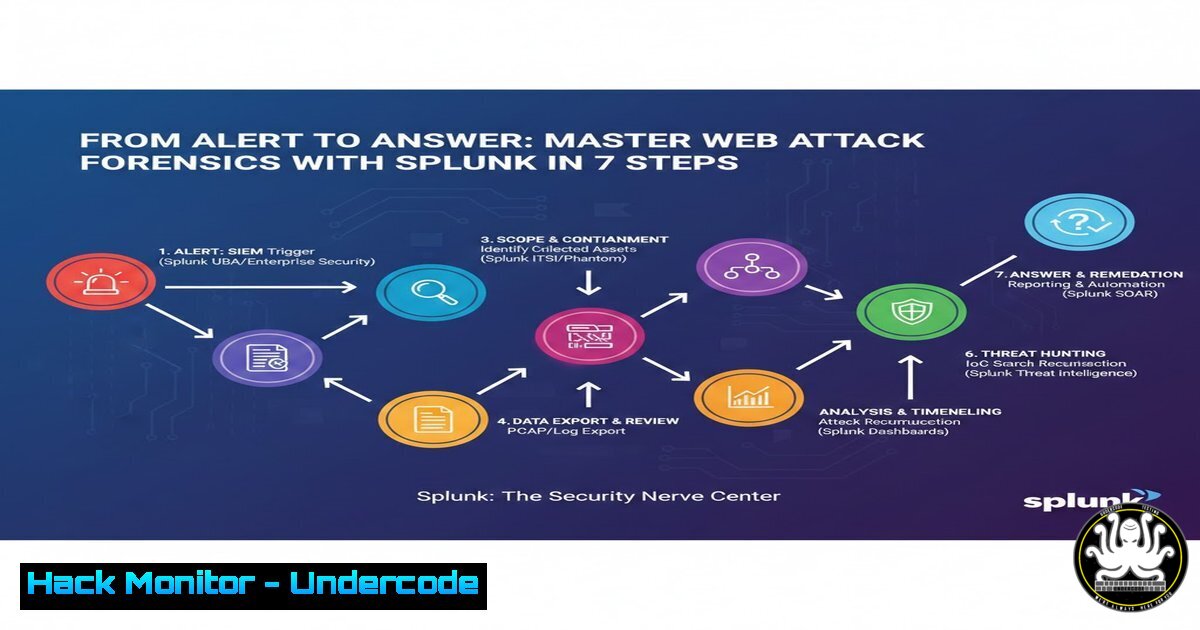
Introduction:
When a web server is compromised, the digital crime scene is written in logs, network flows, and system events. Web attack forensics is the disciplined process of collecting, analyzing, and interpreting this evidence to understand the “who, what, when, and how” of a breach. Using powerful tools like Splunk, security professionals can transform raw, noisy data into a clear narrative of the attack, which is exactly the skill developed in TryHackMe’s “Web Attack Forensics – Drone Alone” room.
Learning Objectives:
- Conduct targeted forensic analysis using Splunk Search Processing Language (SPL) to trace attacker activity.
- Perform essential live response and data collection using built-in OS commands on both Windows and Linux systems.
- Apply security hardening principles to secure a Splunk forensic analysis platform itself.
You Should Know:
1. Laying the Foundation: Core Forensic Data Models
A successful investigation starts by knowing what to look for. In Splunk, data models like “Network Traffic” provide a normalized schema for critical event fields, turning inconsistent log formats into structured evidence. Key fields include `src_ip` (source IP), `dest_ip` (destination IP), dest_port, `action` (e.g., allowed/blocked), and `bytes` transferred. This model helps distinguish simple connection events from those detected by intrusion prevention systems, which use more complex signatures.
Step-by-step guide:
- Access the Data Model: In your Splunk instance, navigate to Settings > Data models. Locate and inspect the “Network_Traffic” model.
- Build a Pivot: Click on the model and select Create a Pivot. This provides a GUI to build queries without memorizing SPL initially.
- Visualize a Baseline: Using the pivot editor, chart the count of network events over the last 24 hours by the `action` field (e.g., `allowed` vs.
blocked). This establishes a normal traffic profile. - Generate the SPL: After creating the pivot, click View Search to see the raw SPL query Splunk built. This is an excellent way to learn SPL syntax. A basic query to list all network traffic might look like:
| from datamodel:"Network_Traffic" | search action="blocked" | table _time, src_ip, dest_ip, dest_port. -
The Investigator’s Playbook: Essential SPL Queries for Hunting
The core of the “Drone Alone” room involves crafting precise SPL queries to find the attacker’s footsteps. The goal is to start broad and iteratively narrow the search using specific keywords, fields, and time ranges.
Step-by-step guide:
- Find Initial Foothold: Search for the creation of suspicious processes. For example, to find a reconnaissance command like `whoami` executed via
cmd.exe, you would use a query such as:index=windows_sysmon cmd.exe whoami. This searches a Sysmon log index for events containing both command components. - Trace the Download: Attackers often download tools. Search for outbound HTTP requests or file writes. Try:
index=web sourcetype=access_combined | search method=GET .exe | stats count by src_ip, uri. - Scope the Activity: Use the `transaction` command to group all events from a single source IP within a specific timeframe. For example:
index= sourcetype= [Your Search] | transaction src_ip maxspan=5m | table src_ip, duration, eventcount.
3. Live Response: Critical Commands for Evidence Acquisition
Before an affected system is powered down, you must collect volatile data. These commands create a snapshot of system state.
Linux Evidence Collection:
Network Connections: Use `ss -tunap` to list all TCP/UDP connections and the associated processes (-p).
Running Processes: The `ps auxf` command shows a forest-view of all running processes.
Historical Connections: The `netstat -plant` command (often still available) is useful for listing network connections.
Capture Traffic: Use `tcpdump` for a packet capture: sudo tcpdump -i eth0 -w forensic_capture.pcap.
Windows Evidence Collection:
Network Capture: Use Microsoft Network Monitor (though archived, still functional). Run `netmon` as Administrator, select the adapter, and start a capture. Save the `.cap` file for analysis.
Filtering Captures: In Network Monitor, apply filters like `IPv4.address==”[bash]”` to isolate relevant traffic.
Process & Connections: Use built-in commands like `netstat -ano` to list connections and their Process IDs (PIDs).
- Enlisting AI: Supercharging Script Analysis with Splunk Attack Analyzer
Modern attacks use obfuscated scripts. Splunk Attack Analyzer’s AI Assistant can automatically decode these, providing a summary, severity rating, and mapping to the MITRE ATT&CK framework.
Step-by-step guide:
- Submit the Artifact: In Splunk Attack Analyzer, submit a suspicious script file (e.g., a PowerShell `.ps1` file) or a malicious URL for analysis.
- Generate AI Analysis: On the job details page, select Static Doc Analysis and find the AI Analysis box.
- Review the Breakdown: Toggle between the Summary, MITRE TTPs, and IOCs and Recommendations tabs. The AI will list the script’s execution steps, highlight malicious code snippets, and provide Indicators of Compromise (IOCs) like external IPs and file hashes for immediate hunting.
5. Hardening Your Forensic Platform: Securing Splunk Itself
Your SIEM and forensic platform is a high-value target. It must be hardened following the principle of least privilege.
Step-by-step guide:
- Manage Access: Configure Role-Based Access Control (RBAC). Use strong authentication methods like LDAP or SAML, and enforce Multi-Factor Authentication (MFA) for administrators.
- Secure Communications: Replace Splunk’s default certificates with your own trusted certificates for all internal and external communications (Splunk Web, forwarder-to-indexer).
- Harden the Environment: Ensure the OS and Splunk service accounts have minimal required privileges. Disable unnecessary features like automatic chart recovery in analytics workspaces.
- Enable Auditing: Turn on Splunk’s internal audit logs to track all configuration changes and user activities within the platform itself.
-
From Forensics to Management: Integrating with Vulnerability Management
Forensic findings must feed into a continuous vulnerability management lifecycle to prevent re-compromise. This cycle involves identifying, evaluating, prioritizing, and remediating weaknesses.
Step-by-step guide:
- Identify: Use the IOCs (e.g., exploited software versions) from your forensic analysis to scan your environment for the same vulnerabilities.
- Evaluate & Prioritize: Score the found vulnerabilities using the Common Vulnerability Scoring System (CVSS). Prioritize patches for systems with the highest score and business criticality.
- Remediate & Verify: Apply patches or configuration changes. Then, use Splunk to verify the fix. Search for the old exploit pattern:
index=endpoint malicious_process="vuln_exploit.exe" | stats count. A successful result should be zero.
7. Proactive Defense: Building Resilient Network Monitoring
Understanding network fundamentals like bandwidth, throughput, and latency is key to spotting anomalies that precede an attack.
Step-by-step guide:
- Establish a Baseline: Use tools like `iftop` on Linux to monitor real-time bandwidth usage per connection. Establish what “normal” throughput looks like for your servers.
- Test Performance: Use `iperf` to conduct controlled bandwidth tests between systems and measure maximum throughput, which can be impacted by congestion.
- Monitor for Anomalies: In Splunk, create an alert for unusual outbound traffic volume from a web server, which could indicate data exfiltration:
index=netops bytes_out > 100000000 | stats sum(bytes_out) by src_ip.
What Undercode Say:
- The Query is the Quest: Effective forensics is less about magic tools and more about the iterative, hypothesis-driven craft of building and refining search queries. The thought process behind the SPL is as important as the final result.
- Context is King: An isolated event is just a log entry. A sequence of events correlated across time, user, and system is a story. The true value of a platform like Splunk is its ability to weave these disparate data points into a comprehensible attack timeline.
Prediction:
The future of web attack forensics lies in the integration of proactive threat hunting with automated, intelligent analysis. As seen with Splunk’s AI Assistant, machine learning will increasingly handle initial triage of obfuscated code and massive data sets, freeing analysts for complex correlation and strategic response. Furthermore, the convergence of forensic tools with vulnerability management platforms will create closed-loop systems where attack findings automatically trigger asset discovery scans and patch prioritization, dramatically shrinking the window of exposure and moving organizations from a reactive to a predictive security posture.
▶️ Related Video (82% Match):
🎯Let’s Practice For Free:
IT/Security Reporter URL:
Reported By: Dorota Kozlowska – Hackers Feeds
Extra Hub: Undercode MoN
Basic Verification: Pass ✅


