
Listen to this Post
Introduction:
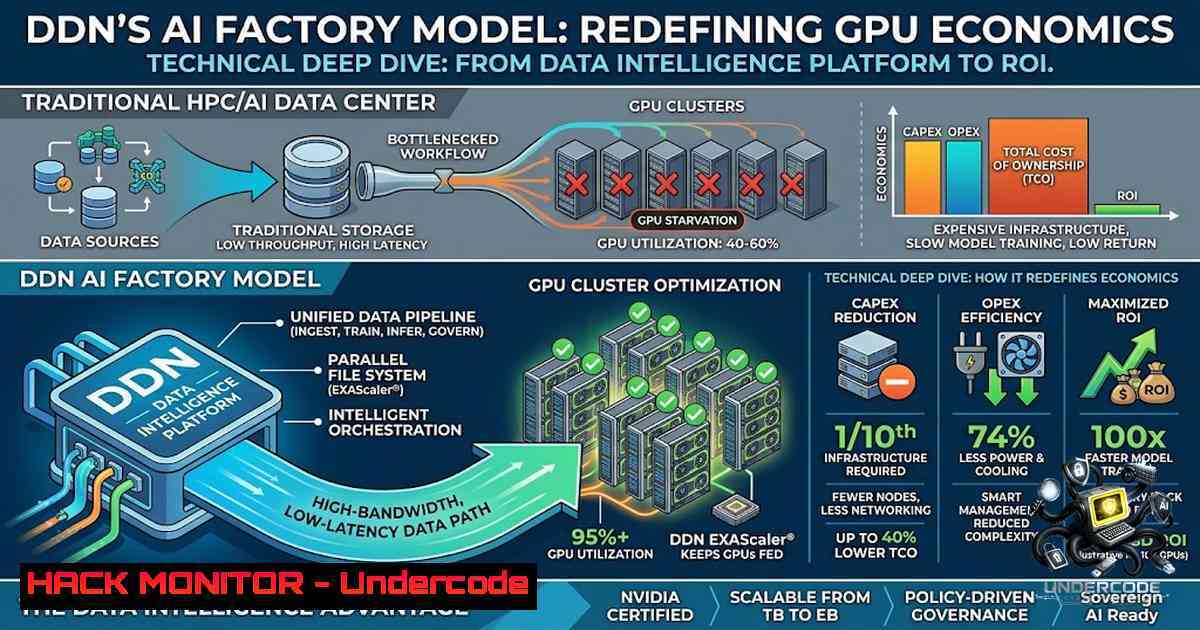
The modern AI infrastructure landscape is shifting from a siloed component model to an integrated “AI Factory” approach. In this paradigm, the primary bottleneck is no longer compute power alone, but the velocity, management, and intelligence of the data pipeline that feeds the GPUs. DDN’s Data Intelligence Platform is at the forefront of this shift, tackling the “idle asset” problem by orchestrating data flows to achieve near-peak GPU utilization. This article extracts technical principles from DDN’s announcement and translates them into actionable architecture patterns, command-line verification techniques, and cloud-hardening strategies for AI workloads.
Learning Objectives & Secrets:
- Objective 1: Understand the metric shift from storage benchmarking to “AI Factory Economics” (GPU utilization, cost-per-token, and tokens-per-watt).
- Objective 2 Secret Tips: Mastering `nvidia-smi` and `dcgm` to measure real-time GPU utilization and compare it against the 90-95% benchmark, identifying data-loading bottlenecks in the OS kernel.
- Objective 3 Secret Tips: Implementing data staging strategies (parallel filesystem, tiered caching) using Linux
rsync,dd, and `lsof` to simulate the “22× faster RAG performance” by reducing time-to-first-byte.
You Should Know:
1. Unlocking GPU Utilization with Real-Time Monitoring
The core promise of DDN is eliminating idle GPUs. The first step to achieving 90-95% utilization in your own environment is visibility. This requires moving beyond simple `top` or `htop` to GPU-level metrics.
- Step‑by‑step guide:
- Install `nvidia-smi` and `dcgmi` (Data Center GPU Manager) on your Ubuntu/Debian node:
sudo apt install nvidia-driver- nvidia-utils-. - Run `watch -1 1 nvidia-smi` to monitor utilization, memory usage, and temperature in real-time. A “Volatile GPU-Util” reading of 30-40% often indicates a data starvation issue.
- Combine with `iostat -x 1` to monitor the storage volume. If `%util` on the storage disk is near 100% while the GPU is at 40%, the storage tier is the bottleneck.
- For Windows environments, utilize the `nvidia-smi` executable located typically in `C:\Program Files\NVIDIA Corporation\NVSMI` via PowerShell:
& 'C:\Program Files\NVIDIA Corporation\NVSMI\nvidia-smi.exe' --query-gpu=utilization.gpu --format=csv.
2. Lowering Time-to-First-Byte (TTFB) for RAG Pipelines
DDN claims a “25× lower time-to-first-byte.” In Retrieval-Augmented Generation (RAG), the latency is determined by how fast the vector database can return contexts to the LLM. Low TTFB often requires data locality and OS-level page cache tuning.
- Step‑by‑step guide:
- To verify TTFB between storage tiers, use `curl -w “Time to first byte: %{time_starttransfer}\n” -o /dev/null -s http://your-storage-1ode/file`.
2. For local filesystem tuning, set the Linux read-ahead buffer to increase sequential pre-fetching: `sudo blockdev –setra 65536 /dev/sdX` (sets read-ahead to 32MB). - Implement a Data Staging script. Move heavy embedding files to a high-speed NVMe scratch space before training starts:
!/bin/bash
Stage data from slow HDD to fast NVMe
SOURCE_DIR="/mnt/archive/embeddings/"
TARGET_DIR="/mnt/nvme_staging/"
rsync -avh --progress $SOURCE_DIR $TARGET_DIR
Symlink the path to the training script
ln -sf $TARGET_DIR /models/current_data
- For Windows, verify TTFB using PowerShell’s `Invoke-WebRequest` and measure the `TimeToFirstByte` property.
-
Building a “Data Intelligence” Layer for Cloud Hardening
The transition from “Compute + Storage” to “Data + Accelerated Compute” implies that data management must be intelligent. In cloud environments (AWS, GCP, Azure), this means eliminating unnecessary data egress and automating snapshot policies.
- Step‑by‑step guide:
- Implement lifecycle policies using `aws s3api` or `az storage` to move checkpoints to “Cold” storage after training.
- Use `s3cmd` or `rclone` to sync data, but implement checksum verification to ensure data integrity during transfer:
rsync -avc --checksum /local/path/ user@remote:/path. - Security Focus: Use `gpg` to encrypt sensitive datasets stored in S3 buckets:
gpg --symmetric --cipher-algo AES256 large_dataset.csv. Then upload. - Set up watchdog scripts to alert if “unnecessary data movement” occurs (e.g., >100GB egress within an hour), using `iftop` or `nethogs` to identify the process PID causing the spike.
4. Optimizing GPU Communication and KV Cache Loading
The integration with NVIDIA Dynamo and rapid KV cache loading (55× faster) highlights the importance of memory sharing. KV caches store the key and value states of the attention mechanism, often reloaded multiple times during long-running inference.
- Step‑by‑step guide:
- To monitor cache usage, use `nvidia-smi` to watch memory usage during inference. Sudden drops in memory usage indicate cache reloads.
- Configuration: In frameworks like PyTorch, utilize `torch.cuda.empty_cache()` with caution, as it can increase latency.
- System Tuning: Adjust the Shared Memory (shm) size of your Docker containers: `docker run –ipc=host –shm-size=64g …` to allow more efficient data sharing between processes, mirroring how dedicated storage platforms minimize cache misses.
- Run `sysctl vm.vfs_cache_pressure=50` to tell the kernel to retain inode and dentry caches longer, assisting with rapid file re-loading.
5. TCO Reduction Strategies (30-40% Savings)
Reducing Total Cost of Ownership (TCO) by 30% is about consolidation. With idle GPU resources costing an estimated $2-4 per hour per A100, a 10% improvement in utilization yields massive savings.
- Step‑by‑step guide:
- Check Idle Costs: Write a bash script to log GPU utilization every minute and calculate idle time:
while true; do
USAGE=$(nvidia-smi --query-gpu=utilization.gpu --format=csv,noheader,nounits)
echo "$(date) - $USAGE%" >> gpu_log.csv
sleep 60
done
- Right-Sizing: In Kubernetes, implement “Vertical Pod Autoscalers” (VPA) to request dynamic GPU resources if the cluster supports MIG (Multi-Instance GPU).
- Data Deduplication: Use `fdupes` or `rdfind` to search for duplicate datasets that are eating storage costs. Remove duplicates and replace with symlinks pointing to a single source of truth.
6. Emulating “AI Factory” Economics in a Sandbox
You don’t need a SuperPOD to test the architecture.
- Step‑by‑step guide:
- Set up a local “Mini-Factory” using a single workstation. Install MinIO (S3 compatible) to simulate a storage tier and a local NVMe drive for the hot tier.
- Write a Python script using `boto3` to simulate file retrieval and measure latency, then implement a caching layer (e.g.,
redis-ai) to cache the most frequent queries. - Run a load test. Use `wrk` or `locust` to hit an inference API. Analyze the throughput. If throughput drops as concurrency rises, the data retrieval mechanism is likely the bottleneck, not the GPU.
What Undercode Say:
- Key Takeaway 1: The metrics that matter are economics—”cost per token” and “time to train”—not IOPS. This aligns with the C-suite requirement to justify capital expenditure on AI hardware.
- Key Takeaway 2: To replicate DDN’s performance, focus on the “Data Pipeline” hygiene. Your storage hardware is secondary to how well your OS (Linux kernel, page cache, I/O scheduler) handles the data flow. The secret is continuous profiling.
Analysis (10 lines):
The post shifts the narrative from “fast hardware” to “intelligent orchestration.” While DDN boasts vendor-specific integration with NVIDIA DGX, the underlying principle is universally applicable: the AI workload requires data locality. For startups, this suggests an emphasis on high-speed NVMe arrays over bloated SANs. For enterprise, it signifies a move towards “data-conditional” compute. The 22× RAG performance is likely due to predictive prefetching—an area often neglected in code. Thus, the IT team’s new role is “Data Traffic Cops,” managing flows to eliminate contention. The security angle is equally significant: minimizing data movement reduces the attack surface. However, the challenge remains: 90% utilization is harder to achieve without tight coupling between hardware and software, which DDN sells as a service. Ultimately, the takeaway is to tune your stack aggressively before buying more hardware.
Prediction:
- +1 Legacy storage vendors will be forced to rebrand as “AI Data Platforms” within the next 12 months.
- +1 Open-source tools (like Apache Arrow and Ray) will integrate deeper with storage APIs to provide a “data-intelligence” layer natively.
- -1 Organizations that neglect data pipeline optimization will see their GPU infrastructure ROI suffer, pushing them toward expensive managed cloud services.
- -1 The dependency on vendor-specific hardware (like SuperPOD) increases lock-in, reducing flexibility for multi-cloud deployments.
▶️ Related Video (78% Match):
🎯Let’s Practice For Free:
🎓 Live Courses & Certifications:
Join Undercode Academy for Verified Certifications
🚀 Request a Custom Project:
Secure, high-velocity infrastructure and disruptive technological engineering. Contact our engineering team for high-tier development and proprietary systems:
[email protected]
💎 Smart Architecture | 🛡️ Secure by Design | ⭐ Trusted by Thousands
IT/Security Reporter URL:
Reported By: https://lnkd.in/p/eGZ9icnA – Hackers Feeds
Extra Hub: Undercode MoN
Basic Verification: Pass ✅


