
Listen to this Post
Introduction:
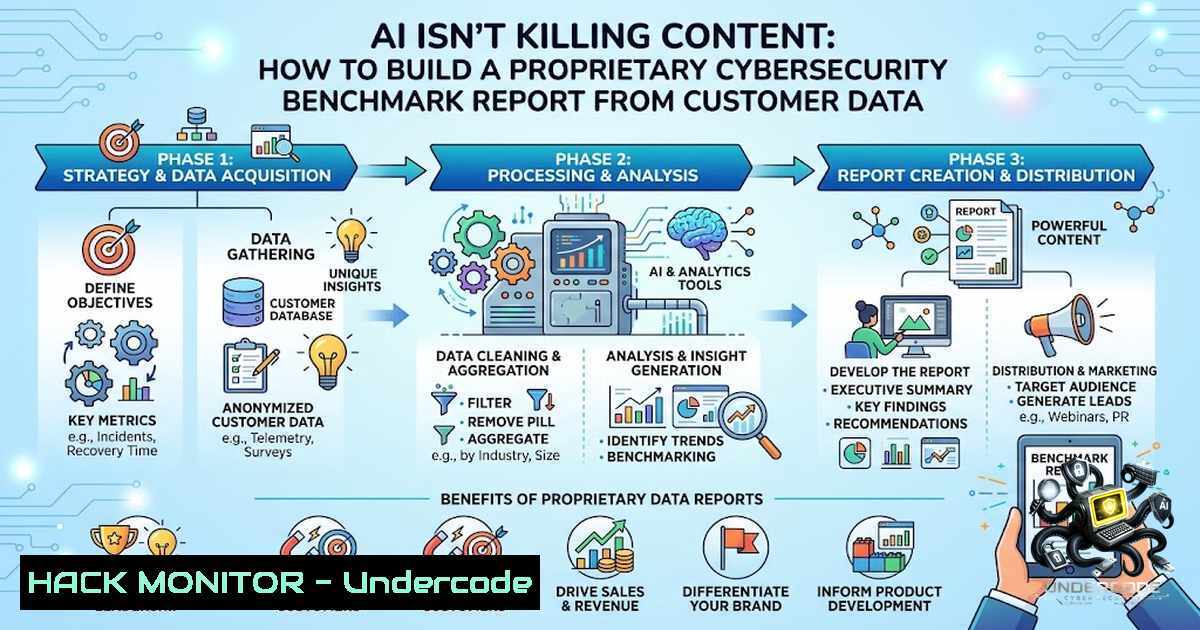
In the cybersecurity landscape, the proliferation of AI-generated content has paradoxically elevated the value of proprietary, data-driven insights. While large language models can synthesize publicly available threat intelligence, they cannot access the unique telemetry, incident response metrics, or vulnerability patterns locked within your customer base. This article explores how security vendors can transform internal customer data—specifically patching cadences, firewall rule efficacy, and phishing simulation outcomes—into a benchmark report that competitors cannot replicate, creating a defensible marketing asset while simultaneously improving customer retention through actionable security comparisons.
Learning Objectives & Secrets:
- Objective 1: Aggregate and Normalize Diverse Security Telemetry – Learn how to extract, clean, and standardize log data from SIEMs, EDRs, and cloud providers (e.g., Azure Sentinel, AWS CloudTrail, CrowdStrike) into a unified schema for cross-customer comparison. Secret Tip: Use a lightweight ETL pipeline with `pandas` and `pyspark` to handle JSON logs; always timestamp-align to UTC to prevent timezone skew in SLA calculations.
- Objective 2: Build Anonymized, Actionable Benchmarks – Develop percentile-based scoring for KPIs like “Mean Time to Detect” (MTTD), “Mean Time to Respond” (MTTR), and “Security Control Coverage.” Secret Tip: Apply z-score normalization to filter outliers; implement differential privacy (e.g., adding Laplace noise) before aggregating to protect customer identities while preserving statistical utility.
- Objective 3: Visualize and Automate Report Generation – Create dynamic dashboards using Python’s `matplotlib` and `plotly` that customers can interact with. Secret Tip: Embed a “Peer Group” selector (e.g., by industry, revenue, or cloud footprint) using
streamlit; schedule the refresh of the underlying aggregation using `cron` jobs or Azure Functions to ensure the benchmark remains current.
You Should Know:
- Data Collection and Normalization: Building the Ingestion Layer
To create a benchmark no one else has, you first need to ingest data from disparate security tools. Begin with API integrations; for example, to pull alert data from your customers’ SIEMs, you might use `requests` in Python with proper API keys. However, raw logs often contain noisy fields.
Step‑by‑step guide:
- Step 1: Define a “Normalized Security Event” schema including mandatory fields:
timestamp,customer_id, `event_type` (e.g., “Malware Alert,” “Blocked Connection,” “Failed Login”),severity, andaffected_asset. - Step 2: Use `jq` on Linux to extract fields from JSON logs before Python processing:
cat raw_siem_logs.json | jq '.[] | {ts: .time, event: .category, severity: .level}' > normalized_events.json - Step 3: For Windows environments, utilize PowerShell to parse event logs via
Get-WinEvent:Get-WinEvent -FilterHashtable @{LogName='Security'; ID=4625} | Select-Object TimeCreated, Message | Export-Csv -Path events.csv - Step 4: Write a Python script using `pandas` to union these sources, handling missing fields with `fillna(‘unknown’)` and converting timestamps with `pd.to_datetime(unit=’s’)` for consistency.
2. Calculating Performance Metrics: The Core Benchmarking Algorithm
Once data is normalized, compute customer-level KPIs. The “Security Response Efficiency” metric, for instance, is defined as the median time from the first detection to the resolution alert.
Step‑by‑step guide:
- Step 1: Group by `customer_id` and
event_type; for each group, calculate the 50th, 75th, and 90th percentiles of the delta between resolution and detection timestamps. - Step 2: Use the following Linux `awk` command to quickly compute the median of a sorted list if you prefer command-line stats:
sort -1 response_times.txt | awk '{a[bash]=$1} END {print a[int(NR/2)]}' - Step 3: In Python, implement the percentile calculation:
import numpy as np benchmark = df.groupby('customer_id')['response_time'].quantile(0.75) - Step 4: Deploy the aggregation as a scheduled job. Use `cron` to run a script every Monday at 2 AM:
0 2 1 /usr/bin/python3 /data/benchmark_pipeline.py >> /var/log/benchmark.log 2>&1
- Security Warning: Ensure the pipeline uses a service principal with minimal permissions; avoid hardcoding secrets. Use Azure Key Vault or AWS Secrets Manager.
3. Anonymization and Differential Privacy Implementation
To generate a report that can be shared externally without exposing individual customer performance, apply k-anonymity or differential privacy. For a dataset of 100+ customers, you can safely release aggregated percentiles. However, for smaller cohorts, add calibrated noise.
Step‑by‑step guide:
- Step 1: Identify quasi-identifiers (e.g., company revenue range, employee count) and suppress or generalize these fields.
- Step 2: Implement the Laplace mechanism in Python:
import numpy as np
sensitivity = 1.0  Example for a count
epsilon = 0.5
noise = np.random.laplace(0, sensitivity/epsilon)
noisy_average = true_average + noise
- Step 3: For a simpler approach, use `pandas` to create deciles instead of exact values:
df['decile'] = pd.qcut(df['mttd'], q=10, labels=False)
- Step 4: Validate the anonymization by running a re-identification risk assessment using `Python` packages like `anonypy` to ensure the risk is below 5%.
4. Creating the Interactive Benchmark Dashboard
A static PDF is outdated; leverage `plotly` and `dash` to build a client-facing portal where customers can compare their performance against the aggregated peer group.
Step‑by‑step guide:
- Step 1: Install the required libraries:
pip install dash plotly pandas numpy gunicorn
- Step 2: Write a minimal `app.py` that reads the latest aggregated CSV and generates a bar chart comparing the current customer to the median:
import dash_core_components as dcc
import dash_html_components as html
... define layout with dcc.Graph(figure=fig)
- Step 3: Secure the dashboard with OAuth2 proxy (e.g., OAuth2-Proxy) to ensure only authenticated customers access their view.
- Step 4: Deploy using `gunicorn` on Linux:
gunicorn -w 4 app:server -b 0.0.0.0:8050
- Step 5: Configure a reverse proxy (Nginx) to terminate TLS and forward traffic to the internal port.
- API Security and Cloud Hardening for the Data Pipeline
Since the pipeline processes sensitive customer data, harden the infrastructure using cloud-1ative security controls.
Step‑by‑step guide:
- Step 1: Store all API keys and database credentials in HashiCorp Vault; retrieve them at runtime using Vault Agent auto-auth.
- Step 2: On Azure, use Managed Identities to avoid storing secrets in code:
from azure.identity import DefaultAzureCredential
credential = DefaultAzureCredential()
- Step 3: Encrypt data at rest using AES-256 (e.g., `openssl` on Linux):
openssl enc -aes-256-cbc -salt -in raw_data.csv -out encrypted_data.enc -pass pass:${ENCRYPTION_KEY} - Step 4: Implement network segmentation: place the processing VM in a private subnet with a Network Security Group (NSG) that only allows inbound from the management jumpbox. Use Azure Application Gateway or AWS WAF to protect the dashboard endpoint from SQL injection and XSS.
6. Vulnerability Exploitation and Mitigation in Benchmark Reports
Be aware that your benchmark report could be a target for cyber espionage. An attacker could use the report to identify customers with slower patching cycles. Mitigate this by never publishing raw IPs or identifiable hostnames; aggregate at the organizational level only.
Step‑by‑step guide:
- Step 1: Run a vulnerability scan on the dashboard server using `Nmap` and
Nessus:nmap -sV --script vuln -p 80,443 dashboard-server.local
- Step 2: Remediate by disabling unnecessary services; apply CIS benchmarks for Linux (e.g.,
sudo apt install lynis && lynis audit system). - Step 3: Monitor for unusual access patterns using
fail2ban:sudo fail2ban-client status sshd
- Step 4: In the report’s terms of service, explicitly state that the data is for informational use and define the permissible sharing scope to prevent misuse.
7. Content Marketing Integration: From Data to Story
Finally, transform the aggregated insights into a compelling narrative. For instance, if your data shows that customers using automated patch management have 40% lower MTTR, build a case study around this.
Step‑by‑step guide:
- Step 1: Extract the most striking insight from the benchmark—e.g., “The top quartile of performers use behavior-based endpoint detection.”
- Step 2: Create a blog post with an “Executive Summary” that highlights this finding, using the interactive dashboard as a visual anchor for prospects.
- Step 3: Prepare a press release and register it on newswires; ensure the URL is shared via your email marketing platform (e.g., Mailchimp) with UTM parameters.
- Step 4: Use Google Analytics 4 and UTM tracking to measure engagement, enabling you to refine future reports based on which sections received the most views.
What Undercode Say:
- Key Takeaway 1: The shift from generic AI-generated content to proprietary data-driven benchmarks is not just a marketing tactic but a strategic moat; it forces competitors to either replicate your customer base or rely on stale public data.
- Key Takeaway 2: Differential privacy and k-anonymity are no longer optional—they are essential to maintaining trust while extracting value from customer telemetry. The technical effort to implement these is outweighed by the business value of a shareable, non‑identifiable report.
Analysis: The concept extends beyond security into IT operations and AI model training. By owning the data aggregation pipeline, a company can continuously refine its own products—for example, using benchmark insights to prioritize feature development for the most common pain points. However, the operational overhead of maintaining a secure, private ETL pipeline should not be underestimated; many vendors will struggle with data quality and normalization. The winners will be those that invest in automated schema validation and anomaly detection to flag integration issues early. Ultimately, this approach transforms customer data from a liability into a competitive asset, aligning with the zero-trust principle of “assume breach” by ensuring that even if the report is leaked, it reveals nothing about individual customers.
Prediction:
- +1 Over the next 18 months, we will see the rise of “Benchmark-as-a-Service” platforms specifically for cybersecurity, enabling smaller vendors to pool anonymized data, further democratizing access to competitive intelligence.
- +1 AI models will be increasingly fine-tuned on proprietary benchmark datasets, leading to more accurate risk scoring and predictive threat modeling, directly improving customer security posture.
- -1 The reliance on aggregated data creates a high‑value target for sophisticated state‑sponsored actors; we anticipate a surge in attacks aimed at corrupting or exfiltrating these benchmark repositories, necessitating quantum‑resistant encryption sooner than expected.
- -1 If not managed carefully, the publication of industry benchmarks could inadvertently highlight systemic weaknesses in specific sectors (e.g., healthcare), potentially impacting stock prices and public trust before mitigations are implemented.
- +1 Regulatory bodies like the SEC may begin to mandate the disclosure of such benchmark metrics for publicly traded companies, accelerating adoption and standardizing reporting frameworks—a net positive for overall market transparency.
▶️ Related Video (78% Match):
🎯Let’s Practice For Free:
🎓 Live Courses & Certifications:
Join Undercode Academy for Verified Certifications
🚀 Request a Custom Project:
Secure, high-velocity infrastructure and disruptive technological engineering. Contact our engineering team for high-tier development and proprietary systems:
[email protected]
💎 Smart Architecture | 🛡️ Secure by Design | ⭐ Trusted by Thousands
IT/Security Reporter URL:
Reported By: https://lnkd.in/p/eweZGXcb – Hackers Feeds
Extra Hub: Undercode MoN
Basic Verification: Pass ✅


