Listen to this Post
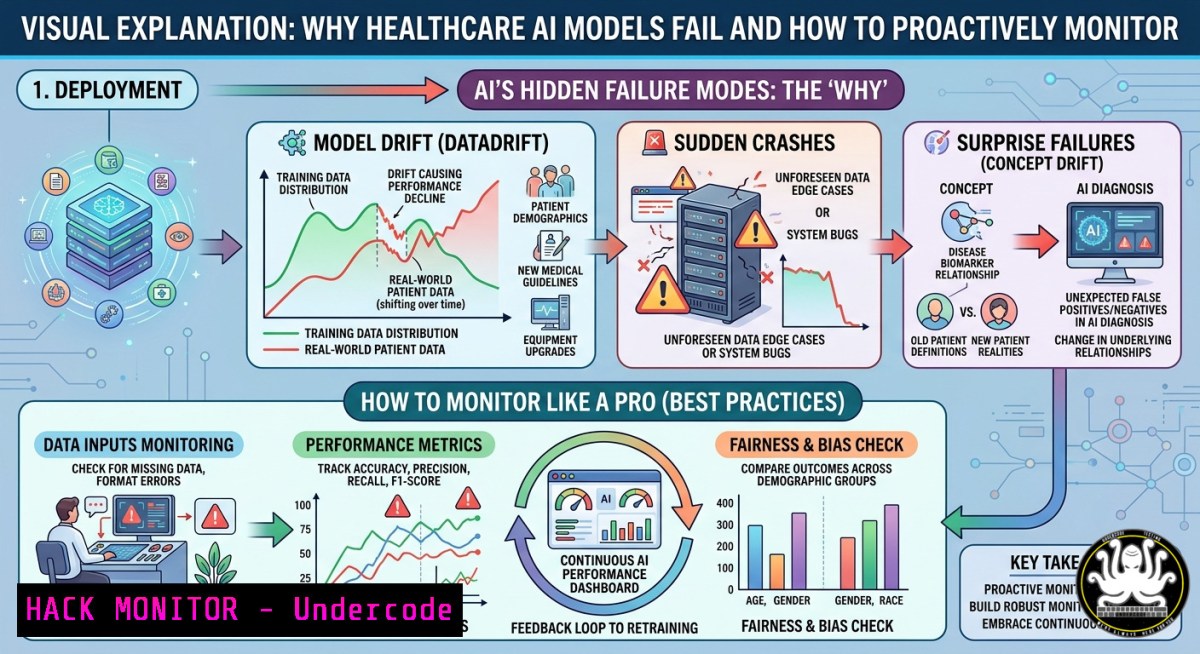
Introduction:
Artificial intelligence systems deployed in healthcare cannot be “set and forget.” Without continuous post-deployment monitoring covering system integrity, performance, and impact, even the most accurate model can silently fail, harming patients and eroding trust. This article extracts a proven three‑pillar framework from NEJM Catalyst and translates it into actionable technical controls, commands, and alerting strategies for security, IT, and AI operations teams.
Learning Objectives:
- Implement real‑time monitoring for AI system integrity, performance drift, and clinical impact across Linux and Windows environments
- Deploy automated drift detection and model fairness checks using open‑source Python libraries and cloud logging tools
- Build incident response playbooks for AI anomalies, including data poisoning, API abuse, and silent performance degradation
You Should Know
- System Integrity Monitoring – Keeping the AI Engine Alive
System integrity ensures the AI service is up, responsive, and free from unexpected runtime or infrastructure errors. This goes beyond basic uptime – it detects silent changes in the IT ecosystem that break model inference.
Step‑by‑step guide to implement integrity checks:
Linux (systemd & journald):
 Check AI service status
systemctl status your-ai-inference.service

Monitor real‑time logs for errors
journalctl -u your-ai-inference.service -f | grep -E "ERROR|FATAL|timeout"

Set up a heartbeat endpoint watch (e.g., every 30s)
watch -n 30 'curl -s -o /dev/null -w "%{http_code}" https://api.yourhospital.ai/health'
Windows (PowerShell – Task Scheduler + Event Logs):
 Get AI service status
Get-Service -Name "AIModelHost" | Select Status, Name

Query Application log for AI errors in last hour
Get-EventLog -LogName Application -Source "AIInference" -After (Get-Date).AddHours(-1) | Where-Object {$_.EntryType -eq "Error"}

Create a scheduled task to ping health endpoint every minute
$action = New-ScheduledTaskAction -Execute "PowerShell.exe" -Argument "-Command Invoke-WebRequest -Uri http://localhost:8080/health -UseBasicParsing"
Register-ScheduledTask -TaskName "AI_HealthCheck" -Action $action -Trigger (New-ScheduledTaskTrigger -RepetitionInterval (New-TimeSpan -Minutes 1) -AtStartup)
What this does: Detects crashes, dependency failures (database, GPU), and network changes. Use Prometheus + Alertmanager to route critical downtimes to pager duty.
- Performance Drift Detection – When the Data Changes but the Model Doesn’t
Clinical practice evolves – new equipment, different patient demographics, or revised note‑writing styles shift input distributions. Performance monitoring tracks accuracy, calibration, and fairness over time.
Step‑by‑step drift detection with Python (Evidently AI):
 Install: pip install evidently pandas scikit-learn
import pandas as pd
from evidently import ColumnMapping
from evidently.report import Report
from evidently.metrics import DataDriftTable, ColumnDriftMetric
from evidently.metric_preset import DataDriftPreset, RegressionPreset

Load reference data (training time) and current production sample
ref_data = pd.read_csv("training_features.csv")
curr_data = pd.read_csv("production_last_week.csv")

Define column mapping (features, prediction, target)
col_map = ColumnMapping(
features=["age", "lab_value", "prior_visits"],
prediction="predicted_risk",
target="actual_30d_readmit"
)

Data drift report
drift_report = Report(metrics=[DataDriftPreset()])
drift_report.run(reference_data=ref_data, current_data=curr_data, column_mapping=col_map)
drift_report.save_html("data_drift_report.html")

Performance regression (if ground truth available daily)
perf_report = Report(metrics=[RegressionPreset()])
perf_report.run(reference_data=ref_data, current_data=curr_data, column_mapping=col_map)
print(perf_report.as_dict()["metrics"][bash]["result"]["rmse"])  alert if > threshold
Automated alerting integration: Schedule this script daily via cron (Linux) or Task Scheduler (Windows). Send JSON output to Slack/Teams when drift exceeds 15% or RMSE doubles.
- Impact Monitoring – Measuring Real‑World Value (or Harm)
Impact asks: does the AI still benefit clinicians, patients, and administrators? This often requires ingesting EHR logs, wait‑time data, and user feedback. It’s the “so what?” pillar.
Step‑by‑step: build an impact dashboard with Azure Log Analytics or AWS CloudWatch
// Azure KQL query – AI recommendation acceptance rate
AIPredictions
| where timestamp > ago(7d)
| where model_name == "sepsis_risk_v2"
| summarize total = count(), accepted = countif(clinician_action == "accepted") by bin(timestamp, 1h)
| extend acceptance_rate = round(accepted  100.0 / total, 1)
| render timechart
Linux log extraction for custom impact metrics (e.g., time saved):
 Parse Apache logs of AI API to count latency spikes (>2s)
awk '$10 > 2 {print $1, $7, $10}' /var/log/ai_api/access.log | tail -20

Calculate daily request volume and failure impact
grep "POST /v1/predict" /var/log/ai_api/access.log | cut -d[ -f2 | cut -d] -f1 | cut -d: -f1 | sort | uniq -c
Windows PowerShell: extract clinician‑action audit logs
Get-WinEvent -FilterHashtable @{LogName='AI Audit'; StartTime=(Get-Date).AddDays(-7)} | Where-Object {$<em>.Message -match "recommendation_accepted|recommendation_rejected"} | Group-Object {$</em>.TimeCreated.Date} | Select Name, Count
Set up a weekly impact report comparing before‑AI vs after‑AI metrics (e.g., time to antibiotic order). If impact turns negative, trigger a governance review.
- Cloud Hardening for AI API Endpoints – Prevent Model Theft and Data Leakage
Public cloud deployments (AWS SageMaker, Azure ML, GCP Vertex AI) need strict perimeter controls, authentication, and rate limiting to avoid API abuse or poisoning.
Step‑by‑step: secure your AI inference endpoint
AWS (API Gateway + Lambda + WAF):
 AWS SAM template snippet – rate limiting + IP whitelist
AiApi:
Type: AWS::Serverless::Api
Properties:
StageName: prod
Auth:
DefaultAuthorizer: CognitoAuthorizer
MethodSettings:
- ResourcePath: "/"
HttpMethod: ""
ThrottlingRateLimit: 10  10 requests per second
ThrottlingBurstLimit: 20
Add AWS WAF rule to block malicious payloads (SQLi, XXE) targeting AI inputs:
aws wafv2 create-web-acl --name ai-inference-acl --scope REGIONAL --default-action Allow={} --visibility-config SampledRequestsEnabled=true,CloudWatchMetricsEnabled=true,MetricName=AiWaf --rules file://sqli_rule.json
Azure API Management – validate JWT and mask PII:
 Set policy to check JWT and redact patient names from logs
<inbound>
<validate-jwt header-name="Authorization" failed-status-code="401" />
<set-variable name="requestBody" value="@(context.Request.Body.As<string>(preserveContent: true))" />
<set-variable name="maskedBody" value="@(System.Text.RegularExpressions.Regex.Replace(context.Variables.GetValueOrDefault<string>("requestBody",""), "\\bpatient_name\\\":\\\"[^\\\"]+\\\"", "\"patient_name\":\"REDACTED\""))" />
</inbound>
Always enforce TLS 1.2+, rotate API keys every 90 days, and enable CloudTrail/Diagnostic logs for all model invocations.
- Vulnerability Exploitation & Mitigation – Adversarial Attacks on Medical AI
Medical AI is vulnerable to adversarial examples (e.g., tiny pixel changes flipping a pneumonia diagnosis) and prompt injection for LLM‑based clinical summarizers.
Demonstrating a simple adversarial attack (Linux, Python + Foolbox):
 pip install foolbox torch torchvision
import foolbox as fb
import torch
import torchvision.models as models

Load a pretrained model (e.g., chest X-ray classifier)
model = models.resnet50(pretrained=True)
model.eval()
fmodel = fb.PyTorchModel(model, bounds=(0, 1))

Get a sample image and label (example)
image, label = fb.utils.samples.sample_image(dataset="imagenet", index=0)  replace with medical image tensor

Apply fast gradient sign attack (FGSM)
attack = fb.attacks.LinfFastGradientAttack()
epsilons = [0.0, 0.01, 0.03, 0.1]
_, advs, success = attack(fmodel, image, label, epsilons=epsilons)

Check success – tiny noise changes prediction
print(f"Original predicted class: {model(image.unsqueeze(0)).argmax()}")
print(f"Adversarial predicted class: {model(advs[bash].unsqueeze(0)).argmax()}")
Mitigation techniques:
- Adversarial training: Add perturbed examples to your training set (using `cleverhans` or `art` libraries).
- Input sanitization: Reject images with out‑of‑distribution noise using a detector (e.g., Mahalanobis distance).
- For LLMs (prompt injection): Use `transformers` to filter input with a secondary classifier; set low temperature and enforce output regex.
Deploy a mitigation script as a sidecar container:
 Run a pre‑inference sanitizer for all image requests
docker run -p 8081:8081 --rm sanitizer:latest --model chest_xray_v1 --threshold 0.85
Then configure your inference API to call the sanitizer first. If anomalous, return 400 – Input suspicious.
- Automated Alerting & Incident Response – When Metrics Go Red
Define response plans: who acts when integrity fails (SRE), when drift triggers (data scientist), when impact turns negative (clinical lead). Use Prometheus + Alertmanager or Azure Monitor Alerts.
Step‑by‑step: Prometheus alert rule for model performance degradation
 /etc/prometheus/alerts/ai_monitoring.yml
groups:
- name: ai_performance
rules:
- alert: ModelDriftHigh
expr: drift_psi{model="sepsis_v2"} > 0.15
for: 2h
labels:
severity: page
team: ml-ops
annotations:
summary: "Model drift exceeded 15% PSI"
runbook: "https://wiki.hospital.ai/runbooks/drift_response"

<ul>
<li>alert: APIErrorRateSpike
expr: rate(http_requests_total{status=~"5.."}[bash]) / rate(http_requests_total[bash]) > 0.05
for: 5m
labels:
severity: critical
annotations:
description: "AI API error rate >5% for 5 minutes"
Windows‑based alerting with Azure Monitor (KQL scheduled query):
// Azure Monitor alert query – drop in AI acceptance rate
AIPredictions
| where timestamp > ago(1h)
| summarize acceptance_rate = avg(todouble(accepted)) by bin(timestamp, 5m)
| where acceptance_rate < 0.4 // 40% threshold
Create an alert rule that triggers an Azure Function to rollback the model version.
Incident response steps for AI (copy this playbook):
- Triage: Check health endpoint, last drift report, and recent logs.
- Contain: If malicious traffic, block source IP at WAF; if drift, revert to previous model snapshot.
- Remediate: Retrain with new data or adjust preprocessing.
4. Post‑mortem: Update monitoring thresholds and runbook.
- Decommissioning AI – Secure Removal and Data Purge
When an AI system is retired (due to low impact or safety concerns), you must securely delete model artifacts, logs, and PII from inference caches.
Step‑by‑step: secure decommission
Linux – shred models and logs:
 Overwrite model files 3 times before deletion
shred -uz /models/sepsis_v2.pkl
 Wipe log directory
find /var/log/ai/ -type f -exec shred -uz {} \;
Windows – cipher + secure deletion:
 Overwrite with cipher (single pass)
cipher /w:C:\AI\models
Remove-Item -Path C:\AI\models -Recurse -Force

Clear Windows Event logs for this source
wevtutil cl "AI Audit"
API gateway revocation: Remove API keys and disable routes.
 AWS CLI: delete usage plan key
aws apigateway delete-api-key --api-key abc123xyz
 Azure: remove policy
az apim api remove --name ai-inference --api-id sepsis_predictor --policy-name cors
Document decommission date, data purging method, and sign‑off from privacy officer – required for HIPAA and GDPR compliance.
What Undercode Say
Key Takeaway 1:
The three buckets – system integrity, performance, impact – work in theory but break in practice because success is defined differently by clinicians (efficiency), administrators (liability), and patients (wait times). You cannot monitor impact with a single metric.
Key Takeaway 2:
Most health systems lack the resources to implement all three pillars. Start with performance drift detection (most technical, easiest to automate) and add impact monitoring by instrumenting user action logs. Integrity monitoring is table stakes – any outage longer than 5 minutes should page someone.
Analysis (10 lines):
The NEJM Catalyst framework is academically sound but operationally naïve without tying metrics to concrete follow‑up actions. The comment by Toby J. Daniel (on the original post) highlights the fatal flaw: “system integrity says lights are on, performance says it’s accurate, but impact monitoring is where it breaks.” A model can have 99.9% uptime and 95% accuracy yet lengthen patient wait times if clinicians ignore its recommendations. True monitoring requires cross‑functional governance with pre‑defined thresholds for decommissioning. For example, if clinician override rate exceeds 40% for two consecutive weeks, the model should be automatically flagged for retraining or removal. Security teams must also watch for adversarial drift – not just natural shifts – which can slowly poison impact metrics. The commands and scripts above give you the technical hooks, but organizational will to act on red metrics remains the hardest part.
Prediction
By 2027, healthcare AI monitoring will become a regulated requirement (e.g., FDA’s “total product lifecycle” for AI‑enabled devices). Expect mandatory monthly drift reports, automated rollback triggers, and third‑party audits of impact metrics. Health systems that fail to implement the three pillars – especially impact monitoring with clinician feedback loops – will face liability lawsuits when silent model decay causes patient harm. Conversely, early adopters will use real‑time monitoring to continuously improve models, turning post‑deployment surveillance into a competitive advantage. Open‑source drift detection (Evidently, Deepchecks) will merge with cloud native observability (OpenTelemetry), making the technical barrier low, but the cultural shift from “deploy and forget” to “continuous governance” will remain the true challenge.
▶️ Related Video (64% Match):
🎯Let’s Practice For Free:
IT/Security Reporter URL:
Reported By: Postdeployment Monitoring – Hackers Feeds
Extra Hub: Undercode MoN
Basic Verification: Pass ✅


