
Listen to this Post
Introduction:
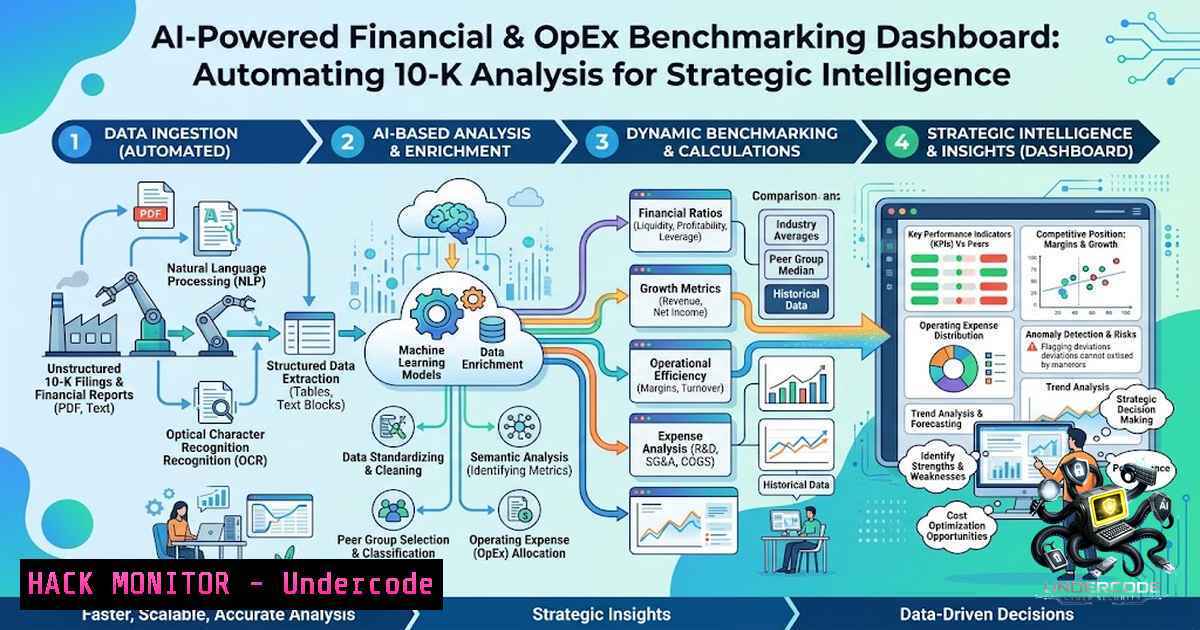
Enterprise valuation extends far beyond top-line revenue—it demands a deep understanding of operational health, lean productivity, and structural operating leverage. Traditional financial analysis of 10-K and 20-F annual reports remains manual, time-consuming, and prone to inconsistent benchmarking across companies and industries. A new wave of AI-powered automation is transforming this landscape: by combining SEC EDGAR crawlers, PDF-to-Markdown parsers, dual-track semantic extraction, and interactive Plotly visualization, analysts can now convert dense regulatory filings into actionable strategic intelligence. This article explores a full-pipeline approach to financial benchmarking that bridges operational excellence with financial performance—enabling intra-industry value chain mapping and cross-industry business model comparisons at scale.
Learning Objectives & Secrets:
- Objective 1: Master Automated SEC Data Extraction – Learn to programmatically retrieve and parse 10-K, 10-Q, and 8-K filings from the SEC EDGAR database using Python libraries like `edgartools` and
sec-api, transforming unstructured regulatory documents into structured financial facts. -
Objective 2 Secret Tip: Dual-Track AI Semantic Extraction – Implement a two-pronged approach combining rule-based XBRL parsing with LLM-powered semantic extraction to capture both quantitative financial metrics and qualitative management discussion—ensuring no critical insight is lost in the automation pipeline.
-
Objective 3 Secret Tip: Multi-Currency Normalization – Handle financial statements denominated in USD, EUR, JPY, and KRW by integrating IMF exchange-rate APIs and pandas-based currency normalization, enabling apples-to-apples comparisons across global companies.
You Should Know:
- Automated SEC EDGAR Crawler & Data Extraction Pipeline
The foundation of any AI-powered financial benchmarking system is a robust data ingestion layer. The SEC’s EDGAR database contains millions of filings, but accessing and parsing them requires careful attention to rate limiting, data structure, and format variations.
Step-by-Step Guide:
Step 1: Install the core libraries
 Linux / macOS / Windows (Python 3.8+)
pip install edgartools sec-api pandas requests
Step 2: Initialize the EDGAR client and fetch a 10-K filing
from edgar import
from sec_api import ExtractorApi

Set your SEC identity (required for rate limiting compliance)
set_identity("Your Name [email protected]")

Get company filings
company = Company("AAPL")  Apple Inc.
filings = company.get_filings(form="10-K")

Get the most recent 10-K
latest_10k = filings.latest()
print(f"Filing Date: {latest_10k.filing_date}")
print(f"Accession Number: {latest_10k.accession_no}")

Extract financial statements
financials = company.get_financials()
print(financials)  Returns structured financial data
Step 3: Extract specific sections using the SEC API
 Initialize the Extractor API
extractorApi = ExtractorApi("YOUR_API_KEY")

Extract specific sections from a 10-K
filing_url = "https://www.sec.gov/Archives/edgar/data/320193/0000320193XXXXX/aapl-10k_XXXXXX.htm"

Extract Item 7 (Management's Discussion & Analysis)
mdna = extractorApi.get_section(filing_url, "7")
print(mdna)

Extract Item 8 (Financial Statements)
financials = extractorApi.get_section(filing_url, "8")
Step 4: Parse XBRL data for structured financial metrics
 Use edgartools to get XBRL facts
company = Company("TSLA")
tenk = company.get_financials()
facts = tenk.facts

Extract specific metrics
revenue = facts.us_gaap.RevenueFromContractWithCustomerExcludingAssessedTax
net_income = facts.us_gaap.NetIncomeLoss
print(f"Revenue: {revenue.value}")
print(f"Net Income: {net_income.value}")
Security & Compliance Note: The SEC enforces rate limits on EDGAR access. Implement exponential backoff and respect the `robots.txt` guidelines. For production deployments, consider using the SEC’s official API or a managed service like Apify’s SEC EDGAR Extractor.
2. PDF-to-Markdown Parsing for LLM-Ready Financial Documents
Many 10-K filings are distributed as PDFs, which present unique challenges for automated extraction. Converting these documents to Markdown preserves structural elements like tables, headings, and lists—making them ideal for LLM processing and semantic analysis.
Step-by-Step Guide:
Step 1: Install a PDF-to-Markdown parser
 Install MinerU for high-fidelity PDF parsing
pip install mineru

Or install fastpdf4llm for lightweight conversion
pip install fastpdf4llm

For jurisdiction-aware financial filings
pip install cartographer-filings
Step 2: Convert a 10-K PDF to Markdown
from mineru import MinerU

Initialize the parser
parser = MinerU()

Convert PDF to Markdown
markdown_output = parser.convert("path/to/10k_filing.pdf")
print(markdown_output)

Save to file
with open("10k_filing.md", "w", encoding="utf-8") as f:
f.write(markdown_output)
Step 3: Extract tables and structured data from Markdown
import pandas as pd
import re

Read the Markdown file
with open("10k_filing.md", "r", encoding="utf-8") as f:
content = f.read()

Extract tables using regex (simplified example)
table_pattern = r'|.|.\n|[-:\s|]+\n((?:|.|\n)+)'
tables = re.findall(table_pattern, content)

Convert to DataFrames
for i, table_text in enumerate(tables):
rows = [row.strip().split('|')[1:-1] for row in table_text.strip().split('\n')]
df = pd.DataFrame(rows)
print(f"Table {i}: {df.shape}")
Step 4: Implement dual-track AI semantic extraction
from langchain_openai import ChatOpenAI
from langchain.schema import HumanMessage

Initialize LLM
llm = ChatOpenAI(model="gpt-4", temperature=0)

Extract financial metrics using LLM
prompt = f"""
Extract the following financial metrics from this 10-K excerpt:
- Revenue (most recent year)
- Gross Profit
- Operating Income
- Net Income
- R&D Expense
- Headcount

Excerpt:
{content[:5000]}  First 5000 characters
"""

response = llm.invoke([HumanMessage(content=prompt)])
print(response.content)
Pro Tip: Combine rule-based XBRL extraction for precise numeric data with LLM-based semantic extraction for contextual insights like risk factors, competitive positioning, and management commentary. This dual-track approach maximizes accuracy while capturing qualitative intelligence.
3. Multi-Currency Normalization for Global Benchmarking
When benchmarking companies across different reporting currencies (USD, EUR, JPY, KRW), inconsistent currency presentation undermines comparability. A robust normalization pipeline ensures all financial metrics are expressed in a single reporting currency using consistent historical exchange rates.
Step-by-Step Guide:
Step 1: Install currency normalization libraries
pip install normalize-currency forex-python imf-fx
Step 2: Normalize currency columns in pandas
import pandas as pd
from normalize_currency import CurrencyNormalizer

Sample data with mixed currencies
df = pd.DataFrame({
'company': ['TSMC', 'ASML', 'Samsung'],
'revenue': ['679B TWD', '28.3B EUR', '302.2T KRW'],
'year': [2025, 2025, 2025]
})

Initialize normalizer
normalizer = CurrencyNormalizer(target_currency='USD')

Normalize all currency columns
df_normalized = normalizer.normalize_dataframe(df, columns=['revenue'])
print(df_normalized)
Step 3: Use IMF exchange rates for historical consistency
from imf_fx import IMFClient

Initialize IMF client
client = IMFClient()

Get historical exchange rates
usd_to_eur = client.get_rate('USD', 'EUR', '2025-12-31')
usd_to_jpy = client.get_rate('USD', 'JPY', '2025-12-31')
usd_to_krw = client.get_rate('USD', 'KRW', '2025-12-31')

print(f"USD/EUR: {usd_to_eur}")
print(f"USD/JPY: {usd_to_jpy}")
print(f"USD/KRW: {usd_to_krw}")

Apply conversions
def convert_to_usd(amount, currency, date):
rate = client.get_rate(currency, 'USD', date)
return amount / rate if rate else None
Step 4: Implement a complete normalization pipeline
import pandas as pd
from datetime import datetime

class CurrencyNormalizerPipeline:
def <strong>init</strong>(self, target_currency='USD'):
self.target = target_currency
self.fx_rates = {}  Cache for exchange rates

def normalize_financials(self, df, currency_col='currency', amount_col='amount'):
"""Normalize financial data to target currency"""
normalized = []

for _, row in df.iterrows():
amount = row[bash]
currency = row[bash]
fiscal_year = row.get('fiscal_year', datetime.now().year)

Get exchange rate for the fiscal year-end
rate = self._get_rate(currency, self.target, fiscal_year)
if rate:
normalized.append({
row.to_dict(),
f'{amount_col}_USD': amount / rate,
'fx_rate_used': rate
})
else:
normalized.append(row.to_dict())

return pd.DataFrame(normalized)

def <em>get_rate(self, from_curr, to_curr, year):
 Implement rate fetching with caching
key = f"{from_curr}</em>{to_curr}_{year}"
if key not in self.fx_rates:
 Fetch from IMF or other source
self.fx_rates[bash] = self._fetch_rate(from_curr, to_curr, year)
return self.fx_rates[bash]
Why This Matters: Without proper currency normalization, cross-industry benchmarking between US-based companies (Apple, NVIDIA), European firms (ASML), and Asian manufacturers (TSMC, Samsung) produces misleading comparisons. Consistent FX normalization ensures accurate aggregation and time-consistent financial comparisons.
- Building the 6-Pillar Strategic Visualization Dashboard with Plotly
The dashboard transforms raw financial data into actionable intelligence through six strategic visualizations: Dual-axis Headcount vs. Gross Margin, Productivity Trio (Revenue/GP/Operating Income per FTE), Operating Profitability & Leverage, R&D Intensity, Growth Dynamics, and Value-vs-Volume Breakdown.
Step-by-Step Guide:
Step 1: Install visualization dependencies
pip install plotly dash streamlit pandas numpy
Step 2: Create the core dashboard structure
import plotly.graph_objects as go
from plotly.subplots import make_subplots
import pandas as pd
import streamlit as st

Sample data structure
data = {
'company': ['TSMC', 'ASML', 'NVIDIA', 'Samsung', 'Apple', 'Amazon'],
'revenue': [79.4, 28.3, 60.9, 200.0, 383.3, 574.8],
'gross_margin': [0.54, 0.51, 0.73, 0.40, 0.46, 0.47],
'headcount': [70000, 42000, 26000, 270000, 164000, 1520000],
'rd_spending': [18.3, 5.2, 9.8, 25.0, 30.0, 42.0],
'operating_income': [31.0, 10.1, 37.0, 30.0, 114.0, 25.0]
}

df = pd.DataFrame(data)

Calculate per-FTE metrics
df['revenue_per_fte'] = df['revenue'] / (df['headcount'] / 1000)  $M per FTE
df['gp_per_fte'] = (df['revenue']  df['gross_margin']) / (df['headcount'] / 1000)
Step 3: Build the 6-Pillar visualization suite
 Pillar 1: Strategic Pivot - Headcount vs. Gross Margin
fig1 = go.Figure()
fig1.add_trace(go.Scatter(
x=df['headcount'],
y=df['gross_margin'],
mode='markers+text',
text=df['company'],
textposition='top center',
marker=dict(size=20, color=df['revenue_per_fte'], colorscale='Viridis', showscale=True),
name='Companies'
))
fig1.update_layout(
title='Strategic Pivot: Headcount vs. Gross Margin',
xaxis_title='Headcount',
yaxis_title='Gross Margin %',
template='plotly_dark'
)

Pillar 2: Productivity Trio
fig2 = make_subplots(rows=1, cols=3, subplot_titles=('Revenue/FTE', 'GP/FTE', 'OpIncome/FTE'))
fig2.add_trace(go.Bar(x=df['company'], y=df['revenue_per_fte'], name='Revenue/FTE'), row=1, col=1)
fig2.add_trace(go.Bar(x=df['company'], y=df['gp_per_fte'], name='GP/FTE'), row=1, col=2)
 Add operating income per FTE similarly
fig2.update_layout(height=400, template='plotly_dark')
Step 4: Deploy as an interactive Streamlit dashboard
import streamlit as st

st.set_page_config(page_title="Financial & OpEx Benchmarking Dashboard", layout="wide")

st.title("🚀 Financial & OpEx Strategic Alignment Dashboard")

Sidebar controls
companies = st.sidebar.multiselect(
"Select Companies to Compare",
options=df['company'].tolist(),
default=df['company'].tolist()
)

Filter data
filtered_df = df[df['company'].isin(companies)]

Display metrics
col1, col2, col3, col4 = st.columns(4)
col1.metric("Avg. Revenue/FTE", f"${filtered_df['revenue_per_fte'].mean():.2f}M")
col2.metric("Avg. Gross Margin", f"{filtered_df['gross_margin'].mean():.1%}")
col3.metric("Total Revenue", f"${filtered_df['revenue'].sum():.1f}B")
col4.metric("Avg. R&D Intensity", f"{filtered_df['rd_spending'].mean():.1f}B")

Display charts
st.plotly_chart(fig1, use_container_width=True)
st.plotly_chart(fig2, use_container_width=True)
Step 5: Implement intra-industry and cross-industry benchmarking
 Define industry segments
industry_segments = {
'Semiconductor Manufacturing': ['TSMC', 'Samsung'],
'Semiconductor Equipment': ['ASML', 'AMAT'],
'AI/Software': ['NVIDIA', 'Palantir', 'Meta'],
'Hardware/Consumer': ['Apple'],
'Logistics/Scale': ['Amazon']
}

Add segment to DataFrame
df['segment'] = df['company'].map({
'TSMC': 'Semiconductor Manufacturing',
'Samsung': 'Semiconductor Manufacturing',
'ASML': 'Semiconductor Equipment',
'NVIDIA': 'AI/Software',
'Apple': 'Hardware/Consumer',
'Amazon': 'Logistics/Scale'
})

Create segment-based benchmarking
segment_stats = df.groupby('segment').agg({
'revenue_per_fte': 'mean',
'gross_margin': 'mean',
'rd_spending': 'sum'
}).round(2)

st.dataframe(segment_stats)
5. Full Pipeline Automation & Source Traceability
The complete pipeline—from SEC crawler to interactive dashboard—must include full traceability, linking every synthesized KPI back to its original 10-K source. This ensures auditability and regulatory compliance.
Step-by-Step Guide:
Step 1: Build the end-to-end pipeline
class FinancialBenchmarkingPipeline:
def <strong>init</strong>(self):
self.extractor = ExtractorApi("YOUR_API_KEY")
self.normalizer = CurrencyNormalizerPipeline()
self.data = []

def run(self, tickers, years):
"""Complete pipeline execution"""
for ticker in tickers:
for year in years:
 Step 1: Fetch filing
filing = self._fetch_10k(ticker, year)

Step 2: Extract structured data
financials = self._extract_financials(filing)

Step 3: Normalize currency
normalized = self.normalizer.normalize_financials(financials)

Step 4: Calculate KPIs
kpis = self._calculate_kpis(normalized)

Step 5: Store with source reference
self.data.append({
'ticker': ticker,
'year': year,
'source_url': filing['url'],
'kpis': kpis,
'raw_extract': filing['raw_text'][:1000]  For traceability
})

return pd.DataFrame(self.data)

def _fetch_10k(self, ticker, year):
 Implementation using edgartools or sec-api
pass

def _extract_financials(self, filing):
 Extract using XBRL parser + LLM
pass

def _calculate_kpis(self, data):
 Calculate Revenue/FTE, Gross Margin, R&D Intensity, etc.
pass
Step 2: Implement source traceability
def trace_kpi_to_source(kpi_name, company, year):
"""Trace a KPI back to its source in the 10-K"""
 Query the database for the specific KPI
result = db.query(f"""
SELECT kpi_value, source_paragraph, source_url
FROM financial_extracts
WHERE company = '{company}'
AND year = {year}
AND kpi_name = '{kpi_name}'
""")

Display the source context
print(f"KPI: {kpi_name}")
print(f"Value: {result['kpi_value']}")
print(f"Source: {result['source_url']}")
print(f"Context: {result['source_paragraph'][:500]}...")

return result
Step 3: Schedule automated updates
 Linux crontab for daily updates
0 6    /usr/bin/python3 /path/to/pipeline/run_benchmarking.py --update-all

Windows Task Scheduler equivalent
 Create a scheduled task to run the Python script daily at 6 AM
- API Security & Cloud Hardening for Financial Data Pipelines
When deploying financial benchmarking pipelines in the cloud, security is paramount. API keys, sensitive financial data, and proprietary algorithms must be protected.
Step-by-Step Guide:
Step 1: Secure API key management
 Linux: Store API keys in environment variables
export SEC_API_KEY="your_secure_key_here"
export OPENAI_API_KEY="your_openai_key"

Windows (PowerShell)
$env:SEC_API_KEY = "your_secure_key_here"
$env:OPENAI_API_KEY = "your_openai_key"

Or use a .env file
echo "SEC_API_KEY=your_secure_key" > .env
echo "OPENAI_API_KEY=your_openai_key" >> .env
chmod 600 .env  Linux: restrict permissions
 Load from .env securely
from dotenv import load_dotenv
import os

load_dotenv()
SEC_API_KEY = os.getenv('SEC_API_KEY')
OPENAI_API_KEY = os.getenv('OPENAI_API_KEY')
Step 2: Implement rate limiting and retry logic
import time
from functools import wraps

def rate_limit(calls_per_second=1):
def decorator(func):
last_called = [0.0]

@wraps(func)
def wrapper(args, kwargs):
elapsed = time.time() - last_called[bash]
left_to_wait = (1.0 / calls_per_second) - elapsed
if left_to_wait > 0:
time.sleep(left_to_wait)
ret = func(args, kwargs)
last_called[bash] = time.time()
return ret
return wrapper
return decorator

@rate_limit(calls_per_second=0.5)  2 seconds between calls
def fetch_sec_filing(ticker):
 SEC API call with rate limiting
pass
Step 3: Encrypt sensitive data at rest
from cryptography.fernet import Fernet

Generate encryption key
key = Fernet.generate_key()
cipher = Fernet(key)

Encrypt sensitive financial data
def encrypt_data(data):
return cipher.encrypt(data.encode())

def decrypt_data(encrypted_data):
return cipher.decrypt(encrypted_data).decode()

Store encrypted in database
encrypted_revenue = encrypt_data("383.3B")
Step 4: Implement cloud security best practices
 AWS Security Group Configuration for Dashboard Deployment
 Allow only HTTPS from specific IP ranges
SecurityGroup:
Type: AWS::EC2::SecurityGroup
Properties:
GroupDescription: Financial Dashboard Security Group
SecurityGroupIngress:
- IpProtocol: tcp
FromPort: 443
ToPort: 443
CidrIp: "your-corporate-ip-range/32"
SecurityGroupEgress:
- IpProtocol: -1
CidrIp: 0.0.0.0/0
What Undercode Say:
- Key Takeaway 1: True enterprise valuation requires integrating operational metrics (Revenue/FTE, Gross Margin per FTE) with traditional financial ratios. The 6-Pillar framework provides a comprehensive view that top-line revenue alone cannot deliver—revealing lean productivity inflection points and structural operating leverage that distinguish market leaders from laggards.
-
Key Takeaway 2: Automation doesn’t replace financial expertise—it amplifies it. By offloading data extraction, normalization, and visualization to AI-powered pipelines, analysts can focus on strategic interpretation: identifying industry trends, assessing competitive moats, and uncovering pricing power dynamics across the semiconductor value chain and beyond.
Analysis: The convergence of AI, automated data extraction, and interactive visualization represents a paradigm shift in financial analysis. Traditional approaches to 10-K analysis are labor-intensive, inconsistent, and backward-looking. The pipeline described here—SEC crawler → PDF-to-Markdown → dual-track AI extraction → multi-currency normalization → Plotly dashboard—enables real-time, comparative intelligence that was previously accessible only to large investment banks with dedicated research teams.
The strategic value lies in the benchmarking capability: comparing TSMC’s manufacturing economics against ASML’s equipment monopoly, NVIDIA’s AI-driven margins against Amazon’s scale logistics, and Apple’s ecosystem hardware against pure-software players like Palantir. This cross-industry perspective reveals that operational efficiency (Revenue/FTE) and pricing power (Gross Margin) are the true drivers of long-term enterprise value, not mere revenue growth.
For cybersecurity and IT professionals, this pipeline also serves as a template for building automated intelligence systems: secure API integration, rate-limited data fetching, encrypted storage, and interactive dashboards—all essential skills in modern DevSecOps and data engineering roles.
Prediction:
- +1 AI-powered financial benchmarking will become standard practice within 18–24 months, as open-source tools like `edgartools` and `sec-api` mature and enterprises recognize the competitive advantage of real-time operational intelligence.
-
+1 The democratization of financial analysis through automated pipelines will level the playing field between institutional investors and independent analysts, driving more efficient capital allocation across industries.
-
-1 Regulatory scrutiny will increase as AI-generated financial insights become more prevalent—companies must maintain full traceability to source documents to avoid misrepresentation claims.
-
+1 Integration of LLM-based semantic extraction will enable qualitative analysis at scale, extracting not just numbers but strategic narratives—risk factors, competitive positioning, and management outlook—from thousands of filings simultaneously.
-
-1 Data quality and normalization remain significant challenges; inconsistent reporting standards across jurisdictions and currencies will continue to produce benchmarking errors without rigorous pipeline validation.
-
+1 The 6-Pillar framework will evolve to include ESG metrics and supply chain resilience indicators, reflecting the broadening definition of enterprise value in the coming decade.
▶️ Related Video (84% Match):
https://www.youtube.com/watch?v=1zW6Uu21Q40
🎯Let’s Practice For Free:
🎓 Live Courses & Certifications:
Join Undercode Academy for Verified Certifications
🚀 Request a Custom Project:
Secure, high-velocity infrastructure and disruptive technological engineering. Contact our engineering team for high-tier development and proprietary systems:
[email protected]
💎 Smart Architecture | 🛡️ Secure by Design | ⭐ Trusted by Thousands
IT/Security Reporter URL:
Reported By: https://lnkd.in/p/eWJTbMBi – Hackers Feeds
Extra Hub: Undercode MoN
Basic Verification: Pass ✅


