Listen to this Post
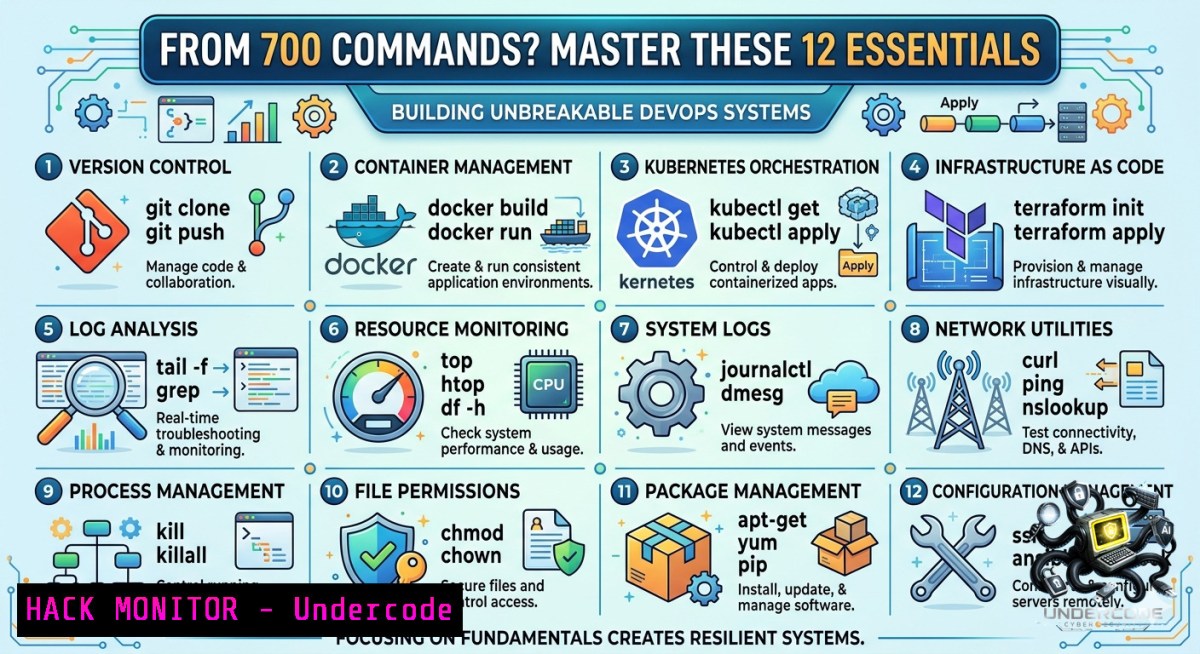
Introduction:
DevOps engineers are often overwhelmed by the sheer number of commands available across Linux, containers, orchestrators, and cloud platforms. The difference between a junior operator and a senior SRE is not the ability to recite every flag, but the operational confidence to select the right command when production breaks. This article extracts the most critical commands from a 700‑command landscape and shows you how to apply them in real troubleshooting, automation, and security hardening scenarios.
Learning Objectives:
- Diagnose live system failures using Linux process, socket, and log inspection commands
- Debug containerized applications and Kubernetes resources with Docker and kubectl
- Automate infrastructure changes safely using Terraform and Ansible, then verify with cloud CLI tools
You Should Know:
- Linux System State & Service Management – `systemctl` and `journalctl`
Step‑by‑step guide:
When a service fails to start or a system behaves strangely, always check the service manager and logs first.
- Check service status and restart:
`sudo systemctl status sshd` — view if SSH is running, its PID, and recent logs.
`sudo systemctl restart nginx` — restart a web server after config changes.
`sudo systemctl enable –1ow prometheus` — enable and start immediately. -
Read system logs with journalctl:
`sudo journalctl -u docker -1 50` — last 50 lines of Docker service logs.
`sudo journalctl -f` — follow live logs (liketail -f).
`sudo journalctl –since “1 hour ago” –priority err` — show only errors from the last hour. -
Windows equivalent:
`Get-Service` | `Restart-Service` | `Get-WinEvent -LogName System -MaxEvents 50`Why this matters for security: Unauthorised service restarts or log clearing attempts can be detected by monitoring `systemctl` history and `journalctl` access logs.
- Network Socket Inspection & Endpoint Testing – `ss` and `curl`
Step‑by‑step guide:
Network issues are the 1 cause of inter‑service failures. Replace deprecated `netstat` with ss.
- List all listening TCP ports with process names:
`sudo ss -tulpn` — shows ports (e.g., :443, :3306) and which process owns them. -
Check for unexpected open ports or SYN‑flood indicators:
`ss -s` — summary of socket statistics (e.g., “TCP: 45 estab, 12 timewait”).
`ss -t state established | wc -l` — count established connections. -
Test API endpoints and debug TLS:
`curl -v https://api.example.com/health` — verbose output includes handshake and headers.
`curl -X POST -H “Content-Type: application/json” -d ‘{“key”:”value”}’ http://localhost:8080/submit`
`curl –insecure https://self-signed.bad` — bypass cert check (only for testing). -
Windows alternative:
Test-1etConnection, `Invoke-WebRequest`Pro tip for SREs: Combine `curl -w` with timing variables (
@connect,@total) to measure API latency.
- Efficient File Synchronisation & Remote Backups – `rsync`
Step‑by‑step guide:
Copying entire directories with `cp` or `scp` is wasteful. Use `rsync` for incremental, checksum‑verified transfers.
- Basic local to remote sync with compression:
`rsync -avz –progress /var/log/ user@backup-server:/backup/logs/`
(`-a`: archive, `-v`: verbose, `-z`: compress)
- Sync one‑way and delete files missing in source (mirroring):
`rsync -av –delete /data/ /backup/data/`
- Dry‑run before destructive operations:
`rsync -av –delete –dry-run /source/ /dest/`
- Windows alternative: `robocopy` (built‑in) or `cwRsync`
Security note: Always run `rsync` over SSH (
-e ssh) for encryption. Avoid plain `rsyncd` without firewalling.
- Container Debugging – `docker logs` and Live Inspection
Step‑by‑step guide:
Containers fail silently. You must extract logs and attach to running processes.
- View container logs from the last 15 minutes and follow:
`docker logs –since 15m -f my_app_container`
- Inspect container resource usage:
`docker stats –1o-stream` — CPU/memory snapshot of all containers. -
Execute a shell inside a broken container (if it still runs):
`docker exec -it my_container /bin/bash` — then useps aux,netstat,df -h. -
For Alpine‑based containers without bash:
`docker exec -it my_container /bin/sh`
- Copy files out of a stopped container:
`docker cp stopped_container:/app/logs/error.log ./`
Hardening tip: Limit container logs to 50MB and use `docker logs` in SIEM ingestion scripts to detect anomalous output (e.g., “SQL syntax error” repeated 100 times).
- Kubernetes Resource Inspection – `kubectl describe` and `kubectl logs`
Step‑by‑step guide:
When a pod crashes or a service doesn’t route traffic, start with `describe` to see events.
- Describe a failing pod for events and status:
`kubectl describe pod my-pod-xyz123` — look at “Conditions” and “Events” (e.g.,BackOff,ImagePullBackOff,FailedMount). -
Stream logs from a multi‑container pod:
`kubectl logs -f my-pod -c sidecar-container`
-
Check resource quotas and limits:
`kubectl describe node worker-1ode-1` — shows allocated vs. available CPU/memory. -
Debug network policies:
`kubectl exec -it my-pod — curl -v service-1ame.namespace.svc.cluster.local:8080`
- Windows/Linux any shell: Same `kubectl` commands work everywhere after configuring
kubeconfig.
Security use case: Use `kubectl auth can-i list pods –as=joe` to verify RBAC permissions. Regularly audit `kubectl describe rolebindings` to catch privilege escalation.
- Infrastructure as Code – `terraform plan` and `ansible-playbook`
Step‑by‑step guide:
Never apply infrastructure changes without previewing them. These commands are your safety net.
- Terraform – preview changes without touching resources:
`terraform plan -out=tfplan` — saves plan to a binary file.
`terraform apply tfplan` — apply exactly the reviewed plan.
`terraform plan -destroy` — preview what will be removed. -
Ansible – dry‑run a playbook:
`ansible-playbook site.yml –check –diff` — shows what files/commands would change.
`ansible-playbook site.yml –limit webservers –ask-become-pass`
- Terraform state manipulation (advanced):
`terraform state list` — see all managed resources.
`terraform import aws_instance.my_instance i-12345` — bring an existing resource under management.
- Windows execution: Run Terraform/Ansible from WSL2 or Git Bash; also native via
choco install terraform.
Best practice: Store plans as artifacts in CI/CD pipelines. Run `terraform validate` and `ansible-playbook –syntax-check` in every PR.
7. Cloud CLI Essentials – `aws`, `az`, `gcloud`
Step‑by‑step guide:
Each cloud CLI has unique commands for monitoring, logging, and security group audits.
- AWS – get S3 bucket size and instance metadata:
`aws s3 ls s3://my-bucket –recursive –human-readable –summarize`
`aws ec2 describe-security-groups –group-ids sg-12345678 –query “SecurityGroups[bash].IpPermissions”`
- Azure – check VM health and log analytics:
`az vm get-instance-view –1ame myVM –resource-group rg1 –query “statuses[bash].displayStatus”`
`az monitor log-analytics query –workspace-id $wsid –analytics-query “Heartbeat | summarize by Computer”` - GCP – IAM policy and audit logs:
`gcloud projects get-iam-policy my-project –format=json`
`gcloud logging read “resource.type=gce_instance AND severity>=ERROR” –limit 20`
- Multi‑cloud tip: Use `jq` to parse JSON outputs, e.g., `aws ec2 describe-instances | jq ‘.Reservations[].Instances[].InstanceId’`
What Undercode Say:
- Key Takeaway 1: DevOps is not a collection of tools but a workflow (observe → diagnose → automate → deploy → monitor → improve). Commands are merely the vocabulary of that workflow.
- Key Takeaway 2: Operational confidence comes from understanding system behaviour under stress, not from rote memorisation. The best engineers run commands to test hypotheses, not to impress peers.
Analysis (10 lines):
The original post correctly highlights a chronic problem in our industry: cert‑driven learning that emphasises command lists over system thinking. In cybersecurity, this manifests as analysts who can type `nmap -p-` but cannot interpret why a SYN‑ACK is missing. By focusing on ss, journalctl, and docker logs, the post aligns with the “blue team” reality – you need to verify service integrity, detect unexpected sockets, and trace container behaviour during an incident. The inclusion of `terraform plan` and `ansible-playbook –check` is crucial for security engineers who review IaC changes. A missing element, however, is any mention of `auditd` or `sysdig` for kernel‑level monitoring, and `openssl` for certificate validation. Additionally, Windows equivalents are rarely taught alongside Linux commands, creating silos. The philosophy of “understanding the system” directly applies to threat modelling – you cannot defend what you do not deeply understand. Ultimately, this DevOps mindset is the same as the purple team mindset: bridge observation with automation to reduce mean time to resolution.
Prediction:
- -1 As infrastructure becomes more ephemeral (serverless, Fargate, Knative), traditional commands like `ss` and `systemctl` will lose relevance for application‑layer troubleshooting, forcing engineers to re‑learn proprietary cloud logging constructs and distributed tracing.
- +1 The DevOps command set will evolve into a universal “observability CLI” (e.g.,
debugctl) that abstracts across Kubernetes, VMs, and cloud functions – reducing cognitive load. - -1 Over‑reliance on `kubectl describe` and `docker logs` without centralised logging will scale poorly; teams that fail to adopt structured logging (JSON, OTEL) will remain in reactive firefighting mode.
- +1 Security automation will increasingly embed commands like `terraform plan` and `ansible-playbook –check` into policy‑as‑code engines (e.g., Open Policy Agent), preventing misconfigurations before they reach production.
▶️ Related Video (86% Match):
🎯Let’s Practice For Free:
🎓 Live Courses & Certifications:
Join Undercode Academy for Verified Certifications
🚀 Request a Custom Project:
Secure, high-velocity infrastructure and disruptive technological engineering. Contact our engineering team for high-tier development and proprietary systems:
[email protected]
💎 Smart Architecture | 🛡️ Secure by Design | ⭐ Trusted by Thousands
IT/Security Reporter URL:
Reported By: Yildizokan Devops – Hackers Feeds
Extra Hub: Undercode MoN
Basic Verification: Pass ✅


