Listen to this Post
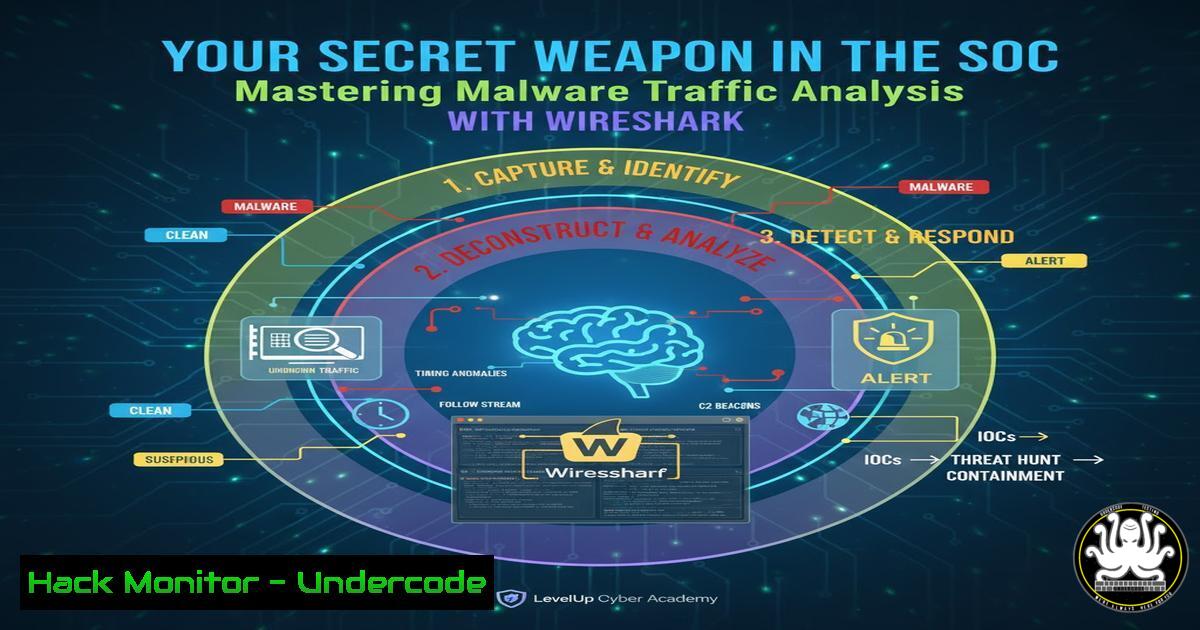
Introduction:
In the high-stakes environment of a Security Operations Center (SOC), every alert demands swift and accurate investigation. Mastering network traffic analysis with tools like Wireshark transforms a reactive analyst into a proactive hunter, capable of dissecting malicious communications and uncovering critical Indicators of Compromise (IoCs). This guide delves into the practical, hands-on techniques for using Wireshark to validate threats, from beaconing malware to data exfiltration attempts.
Learning Objectives:
- Learn to extract key Indicators of Compromise (IoCs) from PCAP files, including malicious IPs, domains, and file hashes.
- Develop the skills to identify and analyze malware beaconing and data exfiltration patterns in network traffic.
- Master essential Wireshark display and conversation filters to efficiently isolate malicious activity from benign noise.
You Should Know:
1. Extracting Core Indicators of Compromise (IoCs)
The first step in any malware traffic analysis is to build a profile of the attack by extracting fundamental IoCs. These are the fingerprints the malware leaves on the network.
Verified Wireshark & Command Line Techniques
 Extract all HTTP Hosts (Domains) from a PCAP
tshark -r malware.pcap -Y http.request -T fields -e http.host | sort | uniq

List all unique destination IP addresses and ports
tshark -r malware.pcap -T fields -e ip.dst -e tcp.dstport | sort -u

Extract HTTP-based file downloads and their URIs
tshark -r malware.pcap -Y "http.response.code == 200 and http.content_type contains \"octet-stream\"" -T fields -e http.request.uri

Calculate an MD5 hash of a downloaded file extracted from the stream
md5sum suspected_malware.exe
 For Windows (PowerShell):
Get-FileHash -Path C:\suspected_malware.exe -Algorithm MD5
Step-by-step guide:
Begin by opening your PCAP file in Wireshark. Use the `tshark` commands (Wireshark’s command-line counterpart) for a quick, scriptable overview. The first command filters for HTTP requests and prints the `http.host` field, revealing all domains the infected machine contacted. The second command provides a unique list of all destination IPs and ports, helping to identify command-and-control (C2) servers. The third command specifically hunts for successful HTTP file downloads, which often contain the malware payload. Finally, once you export the malicious file from the stream (Right-click packet -> Follow -> TCP Stream -> Save As Raw), use the `md5sum` or `Get-FileHash` command to generate a hash, a crucial IoC for blocking the file elsewhere.
2. Hunting for Malware Beaconing
Beaconing is the rhythmic “check-in” communication from infected hosts to a C2 server. Detecting this pattern is key to identifying a compromised machine.
Verified Wireshark Display Filters & IO Graph
 Filter for periodic TCP SYN packets to the same IP (Potential Beaconing)
 Manually analyze the "Time" column for regularity.

Use a Conversations window filter (Statistics -> Conversations -> TCP Tab)
 Look for connections with a high number of packets over a long duration with low data transfer.

Wireshark IO Graph to visualize beaconing:
 1. Go to Statistics -> IO Graph.
 2. Set a filter (e.g., <code>ip.addr == 192.168.1.150</code>) for the suspected internal IP.
 3. Look for sharp, regular spikes in traffic.
Step-by-step guide:
Beaconing is often best identified visually. After applying a basic filter for traffic to or from a suspect internal IP, sort the packet list by the “Time” column and look for connections that occur at suspiciously regular intervals (e.g., every 60 seconds). For a broader view, use the Conversations window (Statistics -> Conversations) and sort by duration or packet count; a long-lived connection with a steady, low volume of packets is a prime candidate. The most powerful method is the IO Graph. Plot the traffic for a suspect IP and change the Y Axis to “Packets/Tick” or “Bytes/Tick”. A clean, periodic spike pattern is a near-certain indicator of malware beaconing.
3. Identifying Data Exfiltration Attempts
Data exfiltration involves unauthorized data transfers from your network. Analysts must spot large, unexpected outbound transfers.
Verified Wireshark Filters & Statistics
 Filter for large HTTP POST requests (common exfiltration method)
http.request.method == "POST" and http.content_length > 10000

Look for DNS tunneling (data encoded in DNS queries)
dns.qry.name.len > 50

Use Endpoints and HTTP/2 Stream graphs:
 1. Statistics -> Endpoints -> IPv4 Tab. Sort by "Bytes Sent".
 2. For HTTP/2, use Statistics -> HTTP2 -> Streams. Look for streams with high "Data" counts.
Step-by-step guide:
To hunt for data exfiltration, start by looking for large HTTP POST requests using the provided filter, adjusting the `content_length` value as needed. For more stealthy methods, inspect DNS traffic for abnormally long query names, which can signal DNS tunneling. The Endpoints window is invaluable here; sort the IPv4 tab by “Bytes Sent” to quickly identify which internal host is sending the most data to the outside, and to which external IP. For modern protocols, the HTTP/2 Streams menu will show you the actual amount of data transferred per stream, making large leaks obvious.
4. Decrypting and Analyzing SSL/TLS Traffic
Many threats operate over encrypted channels. While full decryption may require the server’s private key, you can still extract valuable intelligence.
Verified Wireshark Configuration & Filters
 Configure Wireshark to use RSA Keys (if available):
 1. Go to Edit -> Preferences -> Protocols -> TLS.
 2. In the "(Pre)-Master-Secret log filename" field, browse to your <code>sslkeylogfile</code>.
 3. Wireshark will now decrypt TLS traffic for which it has keys.

Analyze TLS handshake details even without decryption:
tls.handshake.type == 1  Filters for Client Hello packets
tls.handshake.extensions_server_name  Shows the SNI (Server Name Indication)
Step-by-step guide:
If you have access to the client machine’s environment variables (e.g., `SSLKEYLOGFILE` set in a browser), Wireshark can use this file to decrypt TLS traffic. Configure the path in the TLS protocol preferences, and previously encrypted streams will become readable. Without keys, you are not blind. Filter for `tls.handshake.type == 1` to see Client Hello packets. The Server Name Indication (SNI) extension within these packets often reveals the true destination domain the client is trying to connect to, even before the certificate is exchanged, which is a critical IoC.
5. Investigating ARP Spoofing and MITM Attacks
Address Resolution Protocol (ARP) spoofing is a common technique for Man-in-the-Middle (MITM) attacks, redirecting traffic within a local network.
Verified Wireshark Display Filters
 Detect duplicate IP addresses (a sign of ARP spoofing)
arp.duplicate-address-detected

Look for gratuitous ARP replies (unsolicited, often malicious)
arp.isgratuitous

Find hosts with multiple MAC addresses claiming the same IP
 Use: Statistics -> Conversations -> Ethernet Tab. Look for one IP conversing with many MACs.
Step-by-step guide:
ARP traffic is typically low-volume. A sudden flood of ARP packets is a red flag. Use the `arp.duplicate-address-detected` filter to catch instances where two different MAC addresses are claiming the same IP address—a classic sign of spoofing. Also, filter for `arp.isgratuitous` to find unsolicited ARP replies, which attackers use to poison the ARP caches of other hosts on the network. For a broader analysis, the Ethernet tab in the Conversations window can reveal if a single IP address is communicating with an abnormally high number of MAC addresses, indicating a potential MITM host.
6. Automating Analysis with Zeek (formerly Bro)
While Wireshark is for deep-dive analysis, Zeek is a powerful network security monitoring tool that generates high-level logs from PCAPs, perfect for triage.
Verified Zeek Command-Line Usage
 Run Zeek on a PCAP file to generate log files
zeek -r malware.pcap

This generates several logs, including:
 - conn.log: All connection data
 - http.log: All HTTP requests/responses
 - files.log: Extracted file information
 - dns.log: All DNS activity

Search the http.log for specific User-Agents often used by malware
grep -i "python-requests|curl|wget" http.log
Step-by-step guide:
For rapid analysis, run the PCAP through Zeek. Simply execute `zeek -r malware.pcap` in your terminal. Zeek will process the file and output structured log files in the current directory. The `conn.log` is a great starting point, giving a condensed overview of every network connection. The `http.log` and `dns.log` files provide application-layer context that can be easily parsed with command-line tools like grep, awk, or imported into SIEMs for correlation, significantly speeding up the initial IoC collection phase.
7. Integrating IoCs into Active Defense
Finding IoCs is only half the battle. The true value is realized when they are operationalized to improve your organization’s security posture.
Verified Suricata & Firewall Commands
 Add a malicious IP to a Suricata rule for blocking
echo 'drop ip 192.0.2.100 any -> $HOME_NET any (msg:"Blocked Malicious IP from PCAP"; sid:1000001; rev:1;)' >> /etc/suricata/rules/local.rules

Block an IP at the Windows Firewall
New-NetFirewallRule -DisplayName "Block Malicious IP" -Direction Outbound -Profile Any -Action Block -RemoteAddress 192.0.2.100

Query a file hash in VirusTotal via CLI (requires API key)
curl -s --request GET --url "https://www.virustotal.com/api/v3/files/{file_hash}" --header "x-apikey: <YOUR_API_KEY>"
Step-by-step guide:
Once you have a confirmed malicious IP from your Wireshark analysis, you can create a custom rule in your Intrusion Detection System (IDS) like Suricata to automatically drop future traffic. The example rule demonstrates this. Simultaneously, you can implement a temporary block at the host or network firewall level using the provided PowerShell command. Finally, use the `curl` command to query the hash of a suspicious file you extracted against VirusTotal’s database to get a crowd-sourced threat assessment, validating your findings and gathering more context.
What Undercode Say:
- The Network Never Lies: While endpoints can be compromised and logs can be tampered with, raw network traffic provides an immutable, high-fidelity record of an attack. Proficiency with Wireshark is non-negotiable for credible incident validation.
- From Reactive to Proactive: The transition from simply investigating SIEM alerts to hunting for beaconing and exfiltration in PCAPs marks the evolution from a Tier 1 SOC analyst to a seasoned threat hunter. This proactive mindset is what uncovers stealthy, persistent threats that automated tools miss.
The analysis underscores that Wireshark is more than a troubleshooting tool; it is the ultimate truth-teller in the SOC. In an era of encrypted threats and advanced persistent threats (APTs), the ability to interpret the subtle language of network packets—the timing, the protocols, the size, and the destinations—is a superpower. It allows analysts to move beyond signature-based alerts and understand the behavior of an attack, enabling them to find novel malware and sophisticated intrusions that bypass traditional defenses. This deep, fundamental skill set remains relevant regardless of the shifting threat landscape.
Prediction:
As malware continues to evolve towards greater use of encryption, legitimate cloud services for C2 (e.g., hiding in Slack or Discord webhooks), and protocol impersonation, the role of deep packet inspection will become more challenging yet more critical. The future SOC analyst will rely less on simple IP/domain blocking and more on behavioral analysis within the network—identifying anomalies in TLS handshake patterns, detecting statistical outliers in DNS query rates, and using machine learning on flow data to spot these “low and slow” attacks. The fundamentals of traffic analysis mastered with Wireshark will form the essential foundation upon which these next-generation AI-driven detection systems are built and, most importantly, validated.
🎯Let’s Practice For Free:
IT/Security Reporter URL:
Reported By: Daniel Chidera – Hackers Feeds
Extra Hub: Undercode MoN
Basic Verification: Pass ✅


