
Listen to this Post
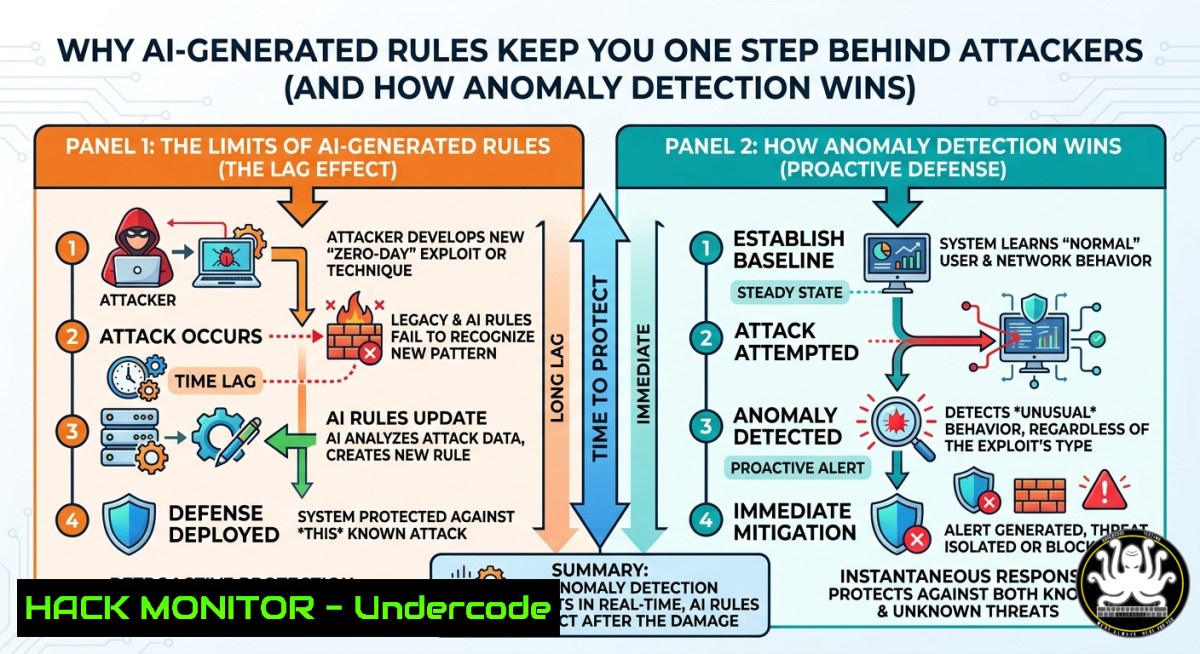
Introduction:
Traditional rule‑based detection (signatures, IOCs, static logic) always reacts to known attack patterns – meaning defenders are perpetually catching up. The core insight, coined as the “attack invariant” at Los Alamos National Laboratory in 2006, states that regardless of the technique, an attacker must introduce change into a system to succeed. Detecting that change through high‑quality time series modeling and context acquisition, rather than generating more rules, is the only sustainable path to catching novel, zero‑day, and polymorphic threats.
Learning Objectives:
- Differentiate between rule‑based detection and anomaly‑based detection, understanding why rules inherently lag behind attacker innovation.
- Implement behavioral baselines on Linux and Windows systems using native tools (auditd, Sysmon, PowerShell) to establish “normal” activity.
- Apply time series modeling and context enrichment to reduce noise and surface true attack‑related change signals.
You Should Know:
1. The Attack Invariant Principle: Change Is Mandatory
An attacker must modify files, create processes, establish network connections, alter registry keys, or change memory state. This unavoidable “attack invariant” means that if you can model the expected steady state of a system, any deviation – even from a never‑before‑seen exploit – becomes detectable. Modern AI vendors selling automated rule generation merely accelerate reaction; they do not solve the prediction problem.
Step‑by‑Step Guide to Operationalize the Attack Invariant:
- Identify critical assets and define their “normal” operational parameters (e.g., which processes listen on which ports, typical parent‑child process relationships, scheduled task frequency).
- For Linux, collect process execution telemetry using
auditd. Configure rules to log all `execve` calls:sudo auditctl -a always,exit -F arch=b64 -S execve -k process_launch sudo auditctl -a always,exit -F arch=b32 -S execve -k process_launch
- For Windows, deploy Sysmon with a configuration that captures process creation (Event ID 1), network connections (Event ID 3), and file creation (Event ID 11). Example minimal config:
<Sysmon>
<EventFiltering>
<ProcessCreate onmatch="exclude"/>
</EventFiltering>
</Sysmon>
- Establish a baseline period of 7–14 days. Collect logs centrally (e.g., ELK, Splunk, or Graylog). Compute simple statistical thresholds: e.g., average number of `cmd.exe` launches per hour, typical PowerShell argument lengths.
2. Time Series Modeling for Security Telemetry
Anomaly detection fails when the “normal” baseline is noisy or constantly shifting. Time series models (e.g., exponential smoothing, ARIMA, or even a rolling median) can adapt to daily/seasonal patterns and highlight statistically significant deviations.
Step‑by‑Step Guide Using Python (Linux/Windows cross‑platform):
- Install required libraries: `pip install pandas numpy statsmodels matplotlib`
– Load your process count data (e.g., per‑minute `execve` events from auditd logs exported to CSV):import pandas as pd from statsmodels.tsa.holtwinters import ExponentialSmoothing</li> </ul> df = pd.read_csv('process_counts.csv', parse_dates=['timestamp']) df.set_index('timestamp', inplace=True) model = ExponentialSmoothing(df['count'], trend='add', seasonal='add', seasonal_periods=1440) daily periodicity in minutes fit = model.fit() df['residual'] = df['count'] - fit.fittedvalues anomalies = df[df['residual'] > 3 df['residual'].std()]– For real‑time detection on Windows, use PowerShell to query recent events and export to a CSV every minute, then trigger the Python script.
– Integrate the anomaly score into a SIEM as a calculated field. Any residual > 3 standard deviations generates an alert.3. Context Acquisition: From Noise to Actionable Alert
Raw anomaly scores produce high false positives. Context – asset criticality, user role, business hours, container immutability – separates benign changes from malicious ones.
Step‑by‑Step Guide for Context Enrichment:
- Build a lookup table mapping each host to its function (e.g., web server, domain controller, developer workstation). In Splunk, use a CSV lookup:
| lookup host_context.csv host OUTPUT role
- For cloud environments (AWS), tag EC2 instances with `Environment=Production` and
DataClassification=Sensitive. At detection time, only generate high‑severity anomalies for sensitive assets. - Use Linux `jq` and `curl` to pull CMDB information and enrich logs in real time:
echo '{"host":"web01"}' | jq -r '.host' | xargs -I {} curl -s "http://cmdb.internal/api/host/{}" | jq '.criticality' - Apply rules of thumb: e.g., an `execve` from `wordpress` process on a web server is anomalous; the same from a software build server is normal.
- Building a Practical Anomaly Detection Pipeline with ELK
The Elastic Stack (Elasticsearch, Logstash, Kibana) provides native machine learning for anomaly detection. This section walks through a free, open‑source approach using aggregations and 3‑sigma thresholds.
Step‑by‑Step ELK Setup:
- Ingest auditd logs via Filebeat. Configure `/etc/filebeat/modules.d/auditd.yml` to enable process events.
- In Kibana, create a Data View for your index. Navigate to Analytics → Dashboard.
- Build a TSVB (Time Series Visual Builder) panel:
- Metric: Count of `process.executable` field.
- Group by: `host.name` and
process.parent.name. - Add a Static anomaly detection configuration: set threshold to `average() + 3 standard_deviation()` over 24h window.
- For command‑line verification, query anomalies directly using Elasticsearch’s aggregations:
POST /auditbeat-/_search
{
"size": 0,
"aggs": {
"hosts": {
"terms": { "field": "host.name", "size": 10 },
"aggs": {
"processes": {
"terms": { "field": "process.executable", "size": 5 },
"aggs": {
"rolling_stddev": {
"moving_fn": { "buckets_path": "_count", "window": 30, "script": "MovingFunctions.stdDev(values, 30)" }
}
}
}
}
}
}
}
5. Adversarial Drift: When Attackers Slow Down
Attackers can evade anomaly detection by introducing change so gradually that it mimics organic baseline drift. To counter this, monitor the rate of change, not just absolute change.
Step‑by‑Step Countermeasure with CUSUM (Cumulative Sum Control Chart):
- CUSUM detects small, sustained shifts. On Linux, use the following Python snippet on process counts:
def cusum(series, target_mean, k=0.5, h=5):
c_plus = [bash]
for x in series:
s = x - target_mean - k
c_plus.append(max(0, c_plus[-1] + s))
if c_plus[-1] > h: return True  sustained shift detected
return False
- Apply this to a 14‑day sliding window of, e.g., network connection rates from `netstat` or
ss -tunp. If CUSUM triggers but the raw value is below traditional thresholds, investigate for stealthy compromise. - For Windows, collect network connection events via PowerShell every 5 minutes:
Get-NetTCPConnection | Group-Object -Property RemoteAddress | Select-Object Count, Name | Export-Csv -Path .\conn_counts.csv -Append
- Cloud Hardening and API Security Through Behavioral Modeling
APIs and cloud workloads introduce ephemeral resources, making static rules obsolete. Anomaly detection here focuses on authentication patterns and API call volume.
Step‑by‑Step for AWS Environment:
- Enable CloudTrail and VPC Flow Logs. Stream them to an S3 bucket.
- Use Athena to query for unusual API call sequences:
SELECT useridentity.username, eventname, COUNT() as cnt
FROM cloudtrail_logs
WHERE eventtime > now() - interval '1' hour
GROUP BY useridentity.username, eventname
HAVING cnt > (SELECT AVG(cnt)3 FROM baseline_table WHERE eventname = cloudtrail_logs.eventname);
- For Kubernetes (EKS), monitor pod‑to‑pod communication using Cilium’s Hubble. Export flow logs and build a baseline of allowed service mesh communications. Any new flow between previously unconnected services triggers an anomaly alert.
What Experts Say (Based on Joshua Neil & Girimaji S.):
– Key Takeaway 1: Rules are inherently reactive – they can only codify attacks already seen. The “attack invariant” (mandatory change) is a timeless detection primitive that AI rule generation misses.
– Key Takeaway 2: Anomaly detection at scale suffers from a brutal signal‑to‑noise problem. Success requires meticulous feature engineering, time series modeling, and dynamic contextual enrichment – not just a plug‑and‑play AI vendor.Prediction:
As adversaries adopt “low‑and‑slow” techniques and leverage legitimate system administration tools (LOLBins), the industry will experience a backlash against AI rule generators by 2027. The winning detection approach will combine lightweight anomaly scoring with supervised learning on the residual changes, plus automated context injection from infrastructure as code. Platforms that fail to move beyond rule churn will suffer high breach rates, while those embracing behavioral invariants will define the next generation of EDR/XDR. Expect MITRE ATT&CK to add a new tactic: “Baseline Drift Evasion” within two years.
▶️ Related Video (80% Match):
🎯Let’s Practice For Free:
IT/Security Reporter URL:
Reported By: Josh Neil – Hackers Feeds
Extra Hub: Undercode MoN
Basic Verification: Pass ✅🔐JOIN OUR CYBER WORLD [ CVE News • HackMonitor • UndercodeNews ]
📢 Follow UndercodeTesting & Stay Tuned:
- Build a lookup table mapping each host to its function (e.g., web server, domain controller, developer workstation). In Splunk, use a CSV lookup:


