
Listen to this Post
Introduction:
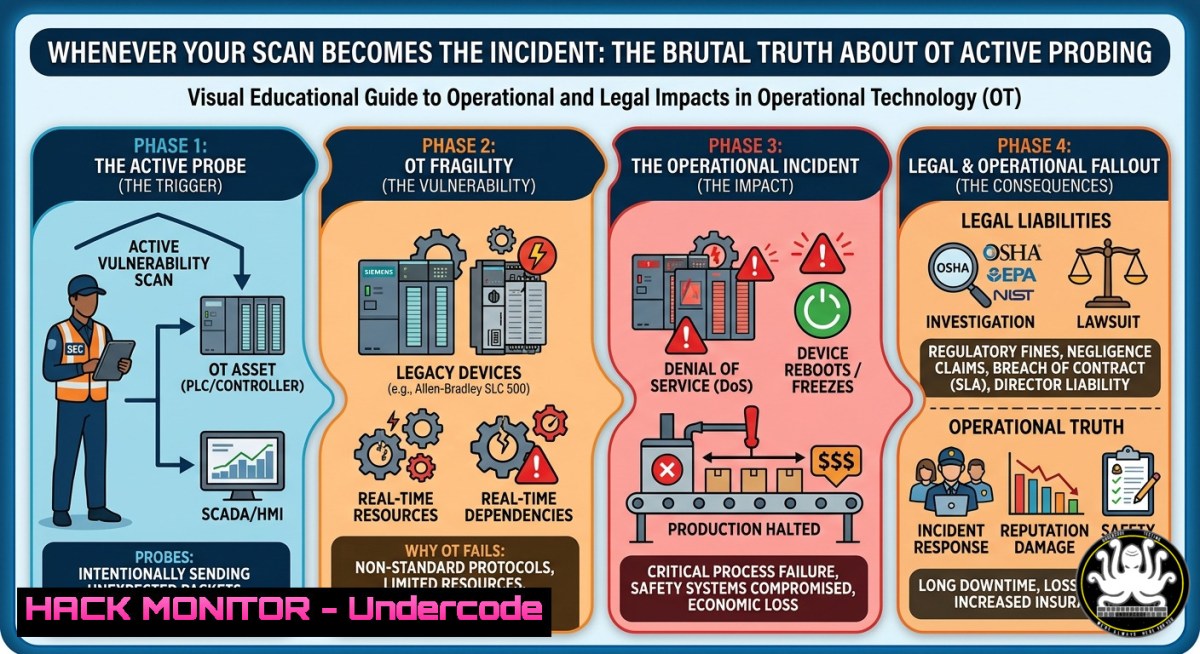
Operational Technology (OT) environments prioritize deterministic timing and system stability over security scanning. Unlike IT networks where active probing is routine, injecting packets into industrial control systems (ICS) can corrupt historian data, trigger PLC watchdog resets, and even simulate a real outage. This article dissects why passive observation must precede active scanning, provides step‑by‑step technical workflows for safe OT discovery, and details the commands, configurations, and abort conditions that separate a professional assessment from a self‑inflicted disaster.
Learning Objectives:
- Differentiate between passive monitoring (SPAN/TAP) and active polling/scanning in OT/ICS networks.
- Implement rate‑limited, operationally‑validated active scanning techniques using Linux and Windows tools.
- Build abort conditions and recovery playbooks to prevent scans from causing PLC resets or false outage alarms.
You Should Know:
- Passive Traffic Analysis – Building the Asset Inventory Without Touching the Wire
Passive scanning observes existing traffic via switch port mirroring (SPAN) or network TAP. It reveals asset fingerprints, protocol usage, polling intervals, and unsafe flat network segments without injecting a single packet.
Step‑by‑step guide (Linux):
- Mirror the OT switch port to a monitoring interface (e.g.,
eth0). - Capture traffic with `tcpdump` limited to ICS protocols (Modbus/TCP, DNP3, S7comm):
sudo tcpdump -i eth0 -s 1500 -G 300 -W 24 -w ot_capture_%Y%m%d_%H%M.pcap 'tcp port 502 or udp port 20000 or tcp port 102'
- Analyze fingerprints using `tshark` to extract Modbus function codes and polling intervals:
tshark -r ot_capture.pcap -Y "modbus.func_code == 1 || modbus.func_code == 2" -T fields -e frame.time_relative -e modbus.unit_id -e modbus.addr
- Use Zeek (formerly Bro) for protocol‑aware asset inventory:
zeek -Cr ot_capture.pcap icsnpp/modbus
cat modbus.log | zeek-cut id.resp_h func
- Windows alternative: Install Npcap and Wireshark, apply display filter
modbus || s7comm || dnp3, then use `Statistics → Protocol Hierarchy` to map discovered endpoints.
- Measuring Polling Intervals – Calculating Operational Timing Windows
SCADA systems expect responses within tight deterministic windows (e.g., 50–500 ms). Active scanning must stay below the smallest operational timeout to avoid comm‑loss alarms.
Step‑by‑step guide:
- Extract request‑response gaps from passive capture using `tshark` and custom script:
tshark -r ot_capture.pcap -Y "modbus" -T fields -e frame.time_relative -e modbus.transaction_id > modbus_timestamps.txt
- Calculate delta with Python:
import pandas as pd df = pd.read_csv('modbus_timestamps.txt', names=['ts','tid']) df['delta'] = df['ts'].diff() print(f"Polling interval min: {df['delta'].min()}s, max: {df['delta'].max()}s") - Identify fragile assets – any PLC with delta below 100 ms must be excluded from active scanning or scanned with
--scan‑delay >= 500ms.
- Rate‑Limited Active Scanning – Injecting Packets Below the Operational Threshold
Once passive mapping is complete, active scanning can begin but must be rate‑limited and coordinated with operations.
Step‑by‑step guide using Nmap (Linux):
- Set max rate to 5 packets/second (well below typical 50‑200 ms SCADA polling):
sudo nmap -sS -p 502 --max-rate 5 --scan-delay 200ms --min-hostgroup 1 192.168.1.0/24
- Use `–max‑parallelism 1` to avoid inter‑packet interference.
- For Windows PowerShell (with nmap installed):
nmap.exe -sT -p 102 --max-rate 3 --scan-delay 500ms 10.10.10.0/24
- Test serial‑over‑Ethernet gateways with `socat` and throttled writes:
echo "READ_COILS" | socat -T 1 - tcp:192.168.1.10:502,forever,intervall=5 | rate -l 10
- Modbus specific scan using `modbus-cli` with delay flag:
modbus-cli scan 192.168.1.0/24 --modbus-port 502 --timeout 500ms --delay 1s --function 1
- Defining Abort Conditions – Automating the Kill Switch
Before any packet injection, define abort conditions (e.g., comm‑loss alarms, watchdog resets, HMI freezes). Implement a monitoring loop that halts scanning immediately.
Step‑by‑step guide (Linux bash):
- Monitor SCADA syslog for keywords:
tail -f /var/log/syslog | while read line; do
if echo "$line" | grep -qi "comm-loss|PLC reset|HMI freeze"; then
pkill -f "nmap"
echo "ABORT: Scan triggered operational alarm" | wall
fi
done
- Monitor ping RTT to critical PLC:
while true; do rtt=$(ping -c 1 192.168.1.100 | grep 'time=' | awk -F 'time=' '{print $2}' | cut -d' ' -f1) if (( $(echo "$rtt > 200" | bc -l) )); then killall nmap break fi sleep 0.5 done - Windows PowerShell abort script:
while ($true) {
$ping = Test-Connection 192.168.1.100 -Count 1 -Quiet
if (-not $ping) { Stop-Process -Name nmap -Force; break }
Start-Sleep -Milliseconds 500
}
- Mapping IT/OT Trust Boundaries – Detecting Unsafe Flat Networks
Use passive ARP and DNS analysis to identify where IT assets directly talk to OT controllers – a common vulnerability exposing PLCs to ransomware.
Step‑by‑step guide:
- Extract all ARP conversations from passive pcap:
tshark -r ot_capture.pcap -Y "arp" -T fields -e arp.src.proto_ipv4 -e arp.dst.proto_ipv4 | sort -u
- Cross‑reference with IT domain controllers – any ARP between IT subnet (e.g., 10.0.0.0/8) and OT subnet (192.168.1.0/24) indicates flat exposure.
- Use Zeek’s `notice.log` to alert on cross‑boundary connections:
zeek -Cr ot_capture.pcap policy/protocols/conn/weird.bro
cat weird.log | grep "cross_boundary"
- Remediation command (Linux) – add iptables rule to block IT→OT routing unless via a jump host:
sudo iptables -A FORWARD -s 10.0.0.0/8 -d 192.168.1.0/24 -j DROP
- Simulating Scan‑Induced Outages – Testing Your Abort Conditions in a Lab
Before production, replicate fragile OT behavior using a virtual PLC (OpenPLC) and rate‑limited scans to train the response team.
Step‑by‑step guide:
- Deploy OpenPLC on Ubuntu:
sudo apt install openplc
- Run a simulated PLC with 100 ms watchdog (Modbus server):
from pyModbusTCP.server import ModbusServer server = ModbusServer("192.168.1.100", 502, no_block=True) server.start() - Launch aggressive scan (to emulate a mistake) and observe the abort script trigger:
nmap -p 502 --max-rate 1000 192.168.1.100 too fast
- Use `tcpreplay` to replay a recorded outage‑causing scan for forensic training:
tcpreplay -i eth0 --pps=500 ot_bad_scan.pcap
What Undercode Say:
- Active scanning in OT is not “advanced” – it’s dangerous when done without passive discovery and operational validation. Most security teams trained in IT assume that more packets equal better coverage. In OT, that assumption directly leads to HMI freezes and false outage investigations.
- The abort condition is more important than the scan itself. If you cannot automatically stop packet injection the moment a PLC watchdog timer drifts, you are gambling with production safety. Build the kill‑switch first, then scan.
Expected Output:
Introduction:
OT scanning is not IT scanning. A single active probe sent without understanding polling intervals can reset a PLC, corrupt a historian, or trigger a false outage that wastes engineering hours. This article provides a safety‑first methodology: passive observation first, rate‑limited active probing second, and automated abort conditions always.
What Undercode Say:
- Passive scanning is your asset inventory – it reveals what exists without changing system behavior. Active scanning is your stress test – it must be validated with operations at the SCADA console before the first packet leaves your NIC.
- The phrase “the scan itself can become the incident” is not theoretical. In 2022, a major European chemical plant suffered a 6‑hour production halt because an internal red team’s unthrottled nmap scan crossed a serial gateway and watchdog‑reset 14 PLCs.
Prediction:
As IT‑OT convergence accelerates, AI‑driven passive analyzers (e.g., Darktrace OT, Nozomi) will replace most active scanning in critical infrastructure. However, attackers will increasingly use “low‑and‑slow” active probing below typical abort thresholds – forcing defenders to implement continuous, adaptive rate limiting on all OT monitoring interfaces. Within 3 years, regulatory bodies (e.g., NERC‑CIP, IEC 62443) will mandate pre‑scan passive analysis as a compliance requirement, making the “scan‑as‑incident” pattern a reportable event rather than a learning opportunity.
▶️ Related Video (82% Match):
🎯Let’s Practice For Free:
IT/Security Reporter URL:
Reported By: Major Sumit – Hackers Feeds
Extra Hub: Undercode MoN
Basic Verification: Pass ✅


