Listen to this Post
Introduction:
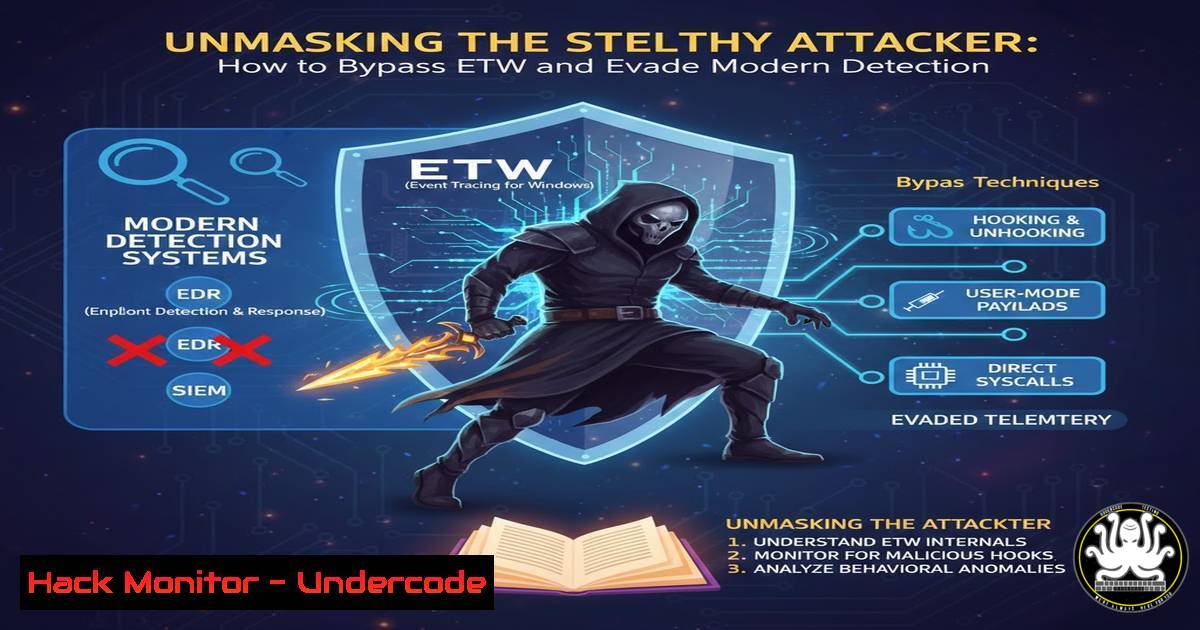
Event Tracing for Windows (ETW) is a powerful kernel-level tracing mechanism that provides deep visibility into process execution, including the use of tools like .NET’s `execute-assembly` within Cobalt Strike. This article deconstructs a novel technique for patching userland ETW hooks in clr.dll, a method that enhances operational stealth by avoiding suspicious APIs and memory protection changes, fundamentally challenging current detection paradigms.
Learning Objectives:
- Understand the role of ETW in detecting in-memory .NET assembly execution.
- Learn the methodology for locating and patching ETW-related function hooks within the Common Language Runtime (CLR).
- Implement a proof-of-concept using a Cobalt Strike Beacon Object File (BOF) to bypass ETW without triggering common alerts.
You Should Know:
- The Foundation: ETW and Why It’s a Threat to Stealth
ETW is an instrumental component of Windows for system and application logging. For cybersecurity, it’s a double-edged sword. Defenders use it to trace malicious activity, while attackers must evade it. When a .NET assembly is executed in-memory via Cobalt Strike’s execute-assembly, the CLR (clr.dll) generates ETW events. These events can reveal the execution of offensive tools like SharpDPAPI, Rubeus, or any custom .NET tradecraft, even before the assembly performs any malicious actions. The core problem is that these events are generated deep within the CLR, making them difficult to suppress without modifying the runtime’s behavior.
- The Achilles’ Heel: Locating ETW Functions in clr.dll
The key to this bypass lies not in disabling ETW system-wide, which is highly detectable, but in surgically patching the specific functions within `clr.dll` that are responsible for firing the events. The technique involves parsing the Portable Executable (PE) headers of `clr.dll` in memory to find the Export Address Table (EAT). From there, we can resolve the virtual addresses of critical functions.
Step-by-Step Guide:
- Get the Module Base Address: The first step is to obtain the base address of the loaded `clr.dll` module within the beacon’s process. This can be done using the Windows API
GetModuleHandleW(L"clr.dll"). - Parse PE Headers: Once the base address is acquired, parse the DOS and NT headers to locate the EAT.
- Resolve Function Addresses: Traverse the EAT to find the virtual addresses of ETW-related functions. The specific functions targeted are those involved in EventWrite, the API used to emit ETW events. By analyzing the `clr.dll` binary, we can identify the exact function names, such as `EventWrite` and
EventWriteTransfer. -
The Art of the Patch: Modifying Code Without Changing Permissions
Traditional patching techniques often use `VirtualProtect` to change memory pages from `PAGE_READONLY` to `PAGE_EXECUTE_READWRITE` before applying the patch. This API call is monitored by many Endpoint Detection and Response (EDR) systems. The novel aspect of this technique is that it leverages the fact that the memory pages where these functions reside are often already marked as executable and writable (PAGE_EXECUTE_READWRITE) when the module is loaded, eliminating the need for a suspicious `VirtualProtect` call.
Step-by-Step Guide:
- Verify Memory Permissions: While the technique avoids changing permissions, it’s good practice to query the current page protection using `VirtualQuery` to confirm it is writable.
- Apply the Patch: Directly write to the function’s memory address. The most straightforward and effective patch is to simply return the function immediately. For x64 systems, this is a two-byte patch: `0xC3` (the `ret` instruction). Overwriting the beginning of the `EventWrite` function with `C3` will cause it to return immediately without performing any action, thereby silencing all ETW events from that function.
3. Assembly-level view of the patch:
; Before Patch (typical prologue):
EventWrite:
48 89 5C 24 10 mov [rsp+10h], rbx
... ; rest of the function

; After Patch (immediate return):
EventWrite:
C3 ret
4. Operationalizing the Bypass: The Cobalt Strike BOF
A Beacon Object File (BOF) is a perfect vehicle for this technique. BOFs are compiled C code executed in the beacon’s memory space, making them very stealthy. The provided BOF performs all the steps above in a single, in-memory execution.
Step-by-Step Guide to Using the BOF:
- Compile the BOF: Use the provided source code from the GitHub repository (https://lnkd.in/gSkdAyZr) and a C compiler like `x86_64-w64-mingw32-gcc` to build the `.o` file.
- Load into Cobalt Strike: Use the `inline-execute` command in Cobalt Strike’s script console to load the BOF.
- Execute: Run the BOF from the beacon. It will automatically find
clr.dll, locate the ETW functions, and apply the patches. After a successful run, subsequent uses of `execute-assembly` will no longer generate the detectable ETW events.
5. Defensive Evasion and OPSEC Considerations
This technique significantly improves the OPSEC of post-exploitation activities. By patching the hooks in userland, it avoids kernel-level interactions and common API calls that EDRs flag. However, defenders are not without options. Detection can shift from focusing on the act of patching to identifying the resulting anomalous behavior—specifically, a process that loads the CLR but generates zero ETW events, which is a highly suspicious signature.
6. Verification and Testing
How do you know the patch worked? The original post’s image shows ETW events revealing SharpDPAPI.exe. The ultimate test is to execute the same tool after applying the BOF and observe the absence of those events in a tool like SilkETW or Windows Performance Analyzer.
Command to test ETW event capture (from an elevated command prompt):
 Capture .NET ETW events using logman
logman create trace "DotNetTrace" -o trace.etl -p {e13c0d23-ccbc-4e12-931b-d9cc2eee27e4} 0xFFFFFF 0x5
logman start "DotNetTrace"
 ... Execute your .NET assembly ...
logman stop "DotNetTrace"
After applying the patch, the trace file should show a significant reduction or complete absence of `EventWrite` events from the beacon’s process.
What Undercode Say:
- The era of relying solely on default `execute-assembly` OPSEC is over. EDRs have adapted, and sophisticated logging will burn your tools. Proactive, in-memory patching of runtime components is becoming a necessity for advanced red teams.
- This technique represents a cat-and-mouse game moving deeper into the software stack. Instead of attacking the EDR process, attackers are now manipulating the foundational components that the EDR relies on for data. This forces defenders to model threats based on behavioral anomalies (e.g., “CLR loaded but no events”) rather than simplistic API hooks.
Prediction:
The technique of surgically patching userland components like `clr.dll` will see rapid adoption in the offensive security community, leading to a short-term increase in the effectiveness of .NET tradecraft. In response, EDR vendors will develop new detection methods, likely focusing on checksum verification of critical runtime DLLs in memory or by moving their sensors deeper into the kernel to monitor for these types of userland modifications. This will inevitably spark a new wave of research into kernel-level ETW tampering and the use of hypervisor-protected code integrity (HVCI) as a final line of defense, further escalating the arms race between attackers and defenders.
🎯Let’s Practice For Free:
IT/Security Reporter URL:
Reported By: Leland Tan – Hackers Feeds
Extra Hub: Undercode MoN
Basic Verification: Pass ✅


