
Listen to this Post
Introduction:
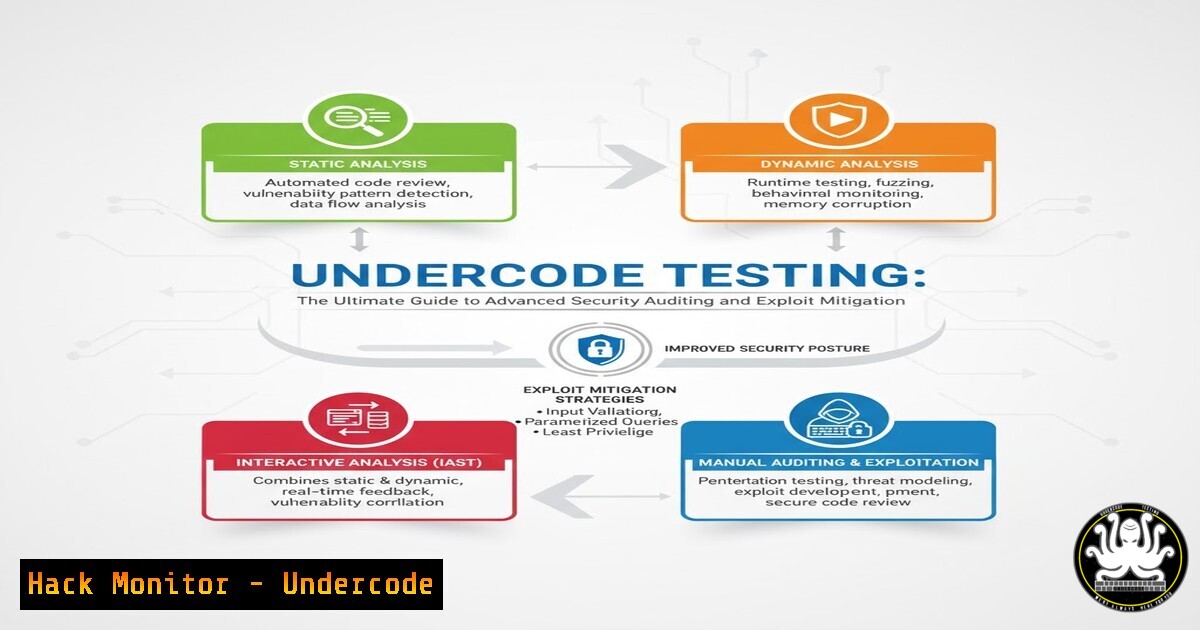
Modern software systems are riddled with hidden vulnerabilities that evade conventional scanning tools. Undercode Testing—a methodology combining static/dynamic analysis, AI-driven anomaly detection, and hands-on exploitation—delves beneath the surface to uncover flaws before attackers do. By integrating deep code inspection with real-world attack simulations, security professionals can proactively harden environments, from on-premise servers to cloud infrastructures, and stay ahead of emerging threats.
Learning Objectives:
- Understand the core principles of Undercode Testing and its role in DevSecOps.
- Set up a cross-platform lab for safe vulnerability analysis and exploitation.
- Execute static and dynamic code analysis using open-source tools on Linux and Windows.
- Leverage AI for anomaly detection and threat hunting in network traffic and logs.
- Apply memory forensics and basic exploit development techniques.
- Harden cloud services and APIs against common attack vectors.
- Implement mitigation strategies to close identified security gaps.
You Should Know:
1. Building Your Undercode Testing Lab
A controlled environment is essential for ethical security testing. Begin by installing virtualization software such as VirtualBox or VMware. Create two virtual machines: one attacker machine (Kali Linux) and one target machine (Windows 10 or an intentionally vulnerable Linux distribution like Metasploitable). Configure a host-only network to isolate your tests from your production network.
Step‑by‑step guide:
- Download and install VirtualBox from virtualbox.org.
- Download Kali Linux ISO and Windows 10 ISO.
- Create a new VM for Kali with at least 4 GB RAM and 20 GB disk; attach the ISO and install.
- Repeat for Windows 10, ensuring both VMs are on the same host-only adapter.
- Verify connectivity: from Kali terminal, run `ip a` to see the assigned IP, then ping the Windows VM’s IP (e.g.,
ping 192.168.56.102). On Windows, use `ipconfig` to find its IP andping <kali-ip>.
2. Static Code Analysis with Open Source Tools
Static analysis reviews source code without executing it, identifying potential security flaws early. On Linux, tools like Flawfinder and Cppcheck are invaluable. On Windows, Visual Studio Code with security linters can catch issues during development.
Step‑by‑step guide (Linux):
- Install Flawfinder:
sudo apt install flawfinder. - Navigate to a C/C++ project:
cd /path/to/source. - Run analysis:
flawfinder –html > report.html. Open the HTML report in a browser to review findings such as buffer overflows or unsafe string functions. - For deeper analysis, use Cppcheck:
sudo apt install cppcheck && cppcheck –enable=all –xml . 2> report.xml.
Windows equivalent:
- Install Visual Studio Code and the C/C++ extension.
- Add the “CodeQL” or “SonarLint” extension for security linting.
- Open your project and review inline warnings about insecure code patterns.
3. Dynamic Analysis and Fuzzing
Fuzzing injects malformed data into applications to trigger crashes and uncover vulnerabilities. American Fuzzy Lop (AFL) is a popular fuzzer on Linux; WinAFL brings similar capabilities to Windows.
Step‑by‑step guide (Linux with AFL):
- Install AFL:
sudo apt install afl. - Compile a target program with AFL instrumentation:
afl-gcc -o vulnerable vulnerable.c. - Create an input directory with seed files:
mkdir in && echo "test" > in/test.txt. - Start fuzzing:
afl-fuzz -i in -o out ./vulnerable @@. Monitor the output for crashes (shown in red) and hangs. - Analyze crashes with GDB: `gdb ./vulnerable core` (if core dumps are enabled).
Windows with WinAFL:
- Install WinAFL and DynamoRIO following the project’s instructions.
- Run a fuzzing session:
winafl -i in -o out -D DynamoRIO\bin64 – target_module target.exe – target_offset 0x1400 – fuzz_iterations 1000 – – target.exe @@.
4. Memory Forensics and Exploit Development
When a crash occurs, memory analysis helps determine exploitability. Volatility is the go‑to framework for memory dump forensics. For exploit development, GDB with PEDA extensions aids in crafting proof‑of‑concept code.
Step‑by‑step guide (Linux memory dump analysis):
- Capture a memory dump from a running Linux VM using LiME:
sudo insmod lime.ko "path=mem.dump format=raw". - Install Volatility:
sudo apt install volatility. - Identify the profile:
volatility -f mem.dump imageinfo. - List running processes:
volatility -f mem.dump –profile=LinuxProfilex64 pslist. - Dump a suspicious process’s memory:
volatility -f mem.dump –profile=LinuxProfilex64 memdump -p <PID> -D dump/. - Use strings and grep to find sensitive data:
strings dump/<PID>.dmp | grep "password".
Basic exploit development (x64 buffer overflow):
- Compile a vulnerable program without stack protections:
gcc -fno-stack-protector -z execstack -o vuln vuln.c. - Debug with GDB:
gdb ./vuln. Use `pattern_create 200` to generate a cyclic pattern. - Run the program with the pattern and note the crash offset.
- Craft an exploit with the correct offset and shellcode.
5. AI-Powered Threat Detection
Machine learning can identify anomalies in logs and network traffic that traditional signatures miss. The ELK Stack (Elasticsearch, Logstash, Kibana) combined with a Python ML model provides a powerful pipeline.
Step‑by‑step guide:
- Install Elasticsearch and Kibana on a Linux server.
- Configure Filebeat to ship system logs to Logstash.
- In Logstash, add a filter to parse logs and forward to Elasticsearch.
- Use a Jupyter notebook to train a simple anomaly detection model (e.g., Isolation Forest) on historical log data.
- Export the model and integrate it with a Python script that queries Elasticsearch for new logs and scores them for anomalies.
- Visualize anomalies in Kibana dashboards.
Example Python snippet:
from sklearn.ensemble import IsolationForest
import elasticsearch
 Fetch logs, preprocess, fit model, predict…
6. Cloud Hardening and API Security
Cloud misconfigurations are a leading cause of breaches. Tools like ScoutSuite assess cloud environments, while OWASP ZAP automates API security testing.
Step‑by‑step guide (AWS hardening with Scout Suite):
- Install Scout Suite:
pip install scoutsuite. - Configure AWS credentials (
aws configure). - Run a scan:
scout aws –report-dir ./scout-report. - Open the generated HTML report to review findings like open S3 buckets or overly permissive IAM roles.
API security with OWASP ZAP:
- Install ZAP from zaproxy.org.
- Start ZAP in daemon mode:
zap.sh -daemon -port 8080. - Use the ZAP API to spider and actively scan an API: `python zap_scan.py –target https://api.example.com`.
- Review the alerts for SQL injection, XSS, and other vulnerabilities.
7. Mitigation Strategies and Patch Management
Once vulnerabilities are identified, rapid mitigation is critical. On Linux, kernel hardening with Grsecurity (if available) or sysctl tweaks can reduce risk. Windows environments should leverage Defender ATP and Group Policy updates.
Step‑by‑step guide (Linux sysctl hardening):
- Edit `/etc/sysctl.conf` to add lines like:
net.ipv4.conf.all.rp_filter=1
net.ipv4.tcp_syncookies=1
kernel.kptr_restrict=2
- Apply changes:
sudo sysctl -p. - Verify:
sysctl net.ipv4.tcp_syncookies.
Windows patch management:
- Use `wuauclt /detectnow` to force Windows Update detection.
- For enterprise, configure Group Policy to enable Windows Defender ATP and set automatic update schedules.
- Run `gpupdate /force` to apply policies immediately.
What Undercode Say:
- Key Takeaway 1: Undercode Testing transforms security from a reactive gatekeeper to a continuous validation process, embedding deep analysis throughout the software lifecycle.
- Key Takeaway 2: Combining traditional exploitation techniques with AI‑driven anomaly detection dramatically increases the chance of catching sophisticated, zero‑day threats before they cause damage.
As software complexity grows, so does the attack surface. Manual testing alone cannot keep pace. Undercode Testing advocates for an automated, multi‑layered approach that scrutinizes code at every level—from source to runtime. By integrating these practices into CI/CD pipelines, organizations can shift left without sacrificing depth. The labs and tools outlined here provide a foundation; the real value lies in continuously adapting them to evolving threats.
Prediction:
Within the next three years, Undercode Testing methodologies will become standard in mature DevSecOps environments. AI‑enhanced tools will autonomously fuzz APIs, correlate cloud misconfigurations, and even suggest patches, reducing the mean time to remediation from weeks to hours. The convergence of exploit development and machine learning will also give rise to predictive threat intelligence, allowing defenders to simulate and block attacks before they are ever launched.
▶️ Related Video (84% Match):
🎯Let’s Practice For Free:
IT/Security Reporter URL:
Reported By: Kostas Nousis – Hackers Feeds
Extra Hub: Undercode MoN
Basic Verification: Pass ✅


