
Listen to this Post
Introduction:
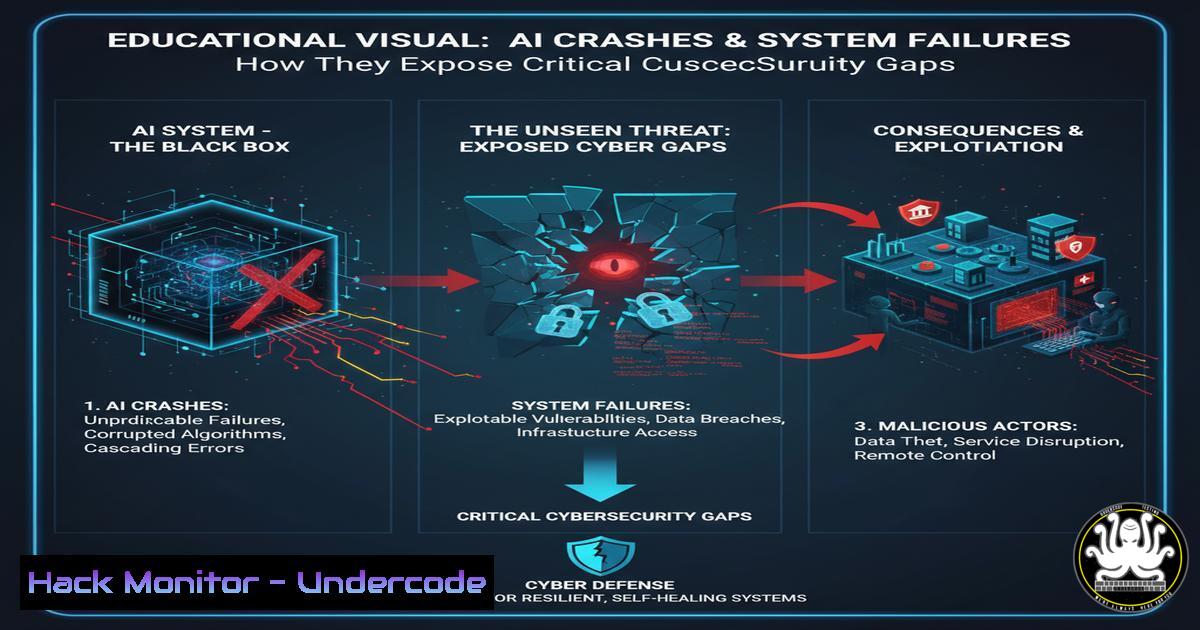
A casual post about a computer or AI crashing mid-work session highlights a far more serious enterprise vulnerability. These system instabilities are not mere inconveniences; they can be symptoms of underlying security flaws, resource exhaustion attacks, or misconfigurations that threat actors can exploit. Understanding the technical root causes and hardening systems against such failures is paramount in today’s interconnected IT environments.
Learning Objectives:
- Diagnose common system and application failure points related to resource exhaustion and software bugs.
- Implement hardening commands for Windows, Linux, and cloud environments to improve stability.
- Develop a response protocol for security incidents that may manifest as system crashes.
You Should Know:
1. Diagnosing System Resource Exhaustion
A system crash often stems from resource starvation. The following commands help diagnose these issues on Linux and Windows systems.
Linux – Check Memory and CPU:
 Display real-time system stats
top
htop  More user-friendly, may require installation
free -h  Check available memory
vmstat 2 5  Report virtual memory statistics every 2 seconds, 5 times
Step-by-step guide: The `top` command provides a dynamic, real-time view of running system processes. The header shows CPU usage (us: user, sy: system, id: idle), memory usage (free, buff/cache), and load average. `free -h` gives a snapshot of total, used, and free memory in human-readable format. `vmstat` helps identify if the system is heavy on swap (si/so columns), indicating memory pressure. High wait time (wa) in CPU indicates I/O bottlenecks.
Windows – Process and Resource Monitor:
 Get a snapshot of processes using the most CPU
Get-Process | Sort-Object CPU -Descending | Select-Object -First 5

Get memory usage
Get-Process | Sort-Object WS -Descending | Select-Object -First 5

Use Resource Monitor (GUI)
resmon
Step-by-step guide: These PowerShell commands extract a list of processes sorted by CPU and Working Set (WS) memory usage, helping identify resource hogs. For a comprehensive GUI-based tool, running `resmon` opens Resource Monitor, which provides detailed views of CPU, memory, disk, and network activity, similar to a combination of `top` and `iotop` on Linux.
2. Controlling Runaway Processes
When a process consumes excessive resources, you need commands to manage it effectively and safely.
Linux – Process Management:
 Find a process by name
pgrep -f "process_name"

View process tree to find parent-child relationships
pstree -p | grep "process_name"

Kill a process gracefully first, then forcefully
kill -15 <PID>  SIGTERM
kill -9 <PID>  SIGKILL (last resort)

Set process limits on CPU time (ulimit is shell-based)
ulimit -t 600  Limits a process to 600 seconds of CPU time
Step-by-step guide: Always attempt a graceful termination (kill -15 or kill <PID>) first, which allows the process to clean up. Use `kill -9` only if the process is unresponsive, as it does not allow for cleanup and can lead to data corruption. The `ulimit` command can be set in a user’s profile to prevent any process they start from exceeding defined resource limits.
Windows – Process Termination:
 Get process by name and stop it
Get-Process -Name "notepad" | Stop-Process

Forcefully stop a process
Stop-Process -Id 1234 -Force

Use Taskkill from command prompt
taskkill /IM "malware.exe" /F
Step-by-step guide: `Stop-Process` is the PowerShell equivalent of kill. The `-Force` parameter is analogous to kill -9. `taskkill` is the classic command-line tool; `/IM` specifies the image name, and `/F` forces termination.
3. AI/ML Service Stability and Security
AI model crashes can be due to GPU memory leaks, corrupted input data, or adversarial attacks.
Python – Check GPU Memory (PyTorch):
import torch

Check if CUDA is available
print(f"CUDA available: {torch.cuda.is_available()}")

Get current GPU memory allocated
print(f"Allocated: {torch.cuda.memory_allocated(0) / 10243:.1f} GB")

Get GPU memory cached by the allocator
print(f"Cached: {torch.cuda.memory_reserved(0) / 10243:.1f} GB")

Clear cache
torch.cuda.empty_cache()
Step-by-step guide: Running this script before and after model inference helps identify memory leaks. A steady increase in allocated memory without a corresponding release indicates a leak. `empty_cache()` forces the GPU memory allocator to free all unused cached memory, which can resolve out-of-memory errors.
Docker – Container Resource Limits:
 Run a container with strict memory and CPU limits
docker run -it --cpus="1.5" --memory="2g" --memory-swap="2g" my-ai-model:latest

Update limits on a running container
docker update --memory="4g" --memory-swap="4g" <container_name>
Step-by-step guide: Enforcing resource limits at the container level prevents a single AI service from consuming all host resources and causing a system-wide crash. The `–cpus` flag limits CPU usage, `–memory` limits RAM, and `–memory-swap` limits total memory (RAM+swap).
4. System Hardening Against Crash-Based Attacks
System failures can be intentionally induced. These commands help harden the OS.
Linux – Kernel Hardening (Sysctl):
 Edit sysctl configuration for security hardening
sudo nano /etc/sysctl.d/99-hardening.conf

Add the following lines:
kernel.dmesg_restrict=1  Restrict kernel log access
kernel.kptr_restrict=2  Restrict kernel pointer addresses
net.ipv4.icmp_echo_ignore_all=1  Ignore ping requests (basic stealth)
fs.suid_dumpable=0  Disable core dumps for SUID programs

Apply the new settings
sudo sysctl -p /etc/sysctl.d/99-hardening.conf
Step-by-step guide: This configuration enhances security by limiting information leakage from the kernel. `dmesg_restrict` prevents non-privileged users from reading kernel logs, which can contain sensitive information after a crash. `kptr_restrict` hides kernel pointers, complicating kernel exploitation.
Windows – Enable Controlled Folder Access (Ransomware Protection):
 Check status of Controlled Folder Access
Get-MpPreference | Select-Object ControlledFolderAccessProtected

Enable Controlled Folder Access (Audit Mode first recommended)
Set-MpPreference -ControlledFolderAccessState 1  0=Off, 1=Audit, 2=On
Step-by-step guide: This feature in Windows Defender helps protect valuable data from ransomware and other malicious encryption attempts by blocking untrusted applications from writing to protected folders. Start in Audit Mode (1) to see what would be blocked before enabling it fully (2).
5. Logging and Forensic Analysis Post-Crash
After a failure, logs are critical for determining if it was a bug or an attack.
Linux – Journalctl for Systemd Logs:
 View logs from the last boot
journalctl -b

Follow logs in real-time
journalctl -f

View logs for a specific service since boot
journalctl -b -u nginx.service

Export logs from the previous boot for analysis
journalctl -b -1 --no-pager > /tmp/previous_boot.log
Step-by-step guide: `journalctl` is the primary tool for querying systemd logs. The `-b` flag filters logs for the current boot. `-b -1` refers to the previous boot, which is essential for analyzing crashes that caused a reboot. `-f` follows new log entries, useful for monitoring.
Windows – Querying System Event Logs:
 Get critical and error events from the system log in the last 24 hours
Get-WinEvent -FilterHashtable @{LogName='System'; Level=1,2; StartTime=(Get-Date).AddHours(-24)} | Select-Object TimeCreated, Id, LevelDisplayName, Message

Get events by specific Event ID (e.g., 41 - Unexpected shutdown)
Get-WinEvent -FilterHashtable @{LogName='System'; Id=41}
Step-by-step guide: PowerShell’s `Get-WinEvent` is a powerful cmdlet for parsing Windows event logs. Filtering by Level (1=Critical, 2=Error) and specific Event IDs (like 41 for unexpected restarts) helps quickly narrow down the cause of a system failure.
6. Automating Health Checks with Scripting
Proactive monitoring can prevent crashes. Simple scripts can serve as early warning systems.
Bash – Basic System Health Check Script:
!/bin/bash
 health_check.sh

THRESHOLD=90
CPU_USAGE=$(top -bn1 | grep "Cpu(s)" | awk '{print $2}' | cut -d'%' -f1)
MEM_USAGE=$(free | grep Mem | awk '{printf("%.2f"), $3/$2  100.0}')
DISK_USAGE=$(df / | awk 'END{print $5}' | sed 's/%//')

echo "CPU: $CPU_USAGE% | Memory: $MEM_USAGE% | Root Disk: $DISK_USAGE%"

Check if any metric exceeds the threshold
if (( $(echo "$CPU_USAGE > $THRESHOLD" | bc -l) )) || \
(( $(echo "$MEM_USAGE > $THRESHOLD" | bc -l) )) || \
[ "$DISK_USAGE" -gt $THRESHOLD ]; then
echo "WARNING: Resource usage exceeded threshold of $THRESHOLD%" | mail -s "System Alert" [email protected]
fi
Step-by-step guide: This script checks three key metrics. `top -bn1` runs `top` in batch mode for one iteration. `free` and `df` extract memory and disk usage. The `if` statement uses `bc` for floating-point comparisons and sends an email alert if any threshold is breached. This script can be run as a cron job.
7. Cloud Instance Hardening (AWS CLI Examples)
Cloud VMs are not immune. These commands help secure an EC2 instance.
AWS CLI – Security Group and IMDSv2:
 Update a security group to restrict unnecessary inbound traffic
aws ec2 revoke-security-group-ingress \
--group-id sg-1234567890abc \
--protocol tcp \
--port 22 \
--cidr 0.0.0.0/0

aws ec2 authorize-security-group-ingress \
--group-id sg-1234567890abc \
--protocol tcp \
--port 22 \
--cidr 203.0.113.1/32  Your trusted IP only

Enforce IMDSv2 to protect against SSRF attacks
aws ec2 modify-instance-metadata-options \
--instance-id i-1234567890abcdef0 \
--http-tokens required \
--http-endpoint enabled
Step-by-step guide: The first command pair removes a overly permissive SSH rule and replaces it with one allowing access only from a specific IP. The `modify-instance-metadata-options` command is critical: it enforces IMDSv2, which adds a token-based requirement for accessing the instance metadata service, mitigating a common attack vector used in server-side request forgery (SSRF) exploits.
What Undercode Say:
- A system crash is a security event until proven otherwise. It can be the symptom of a successful exploit, not just a hardware or software flaw.
- Proactive resource governance and system hardening are non-negotiable for modern IT operations. Relying on reactive measures post-failure exposes the organization to unacceptable risk.
The anecdotal “AI crash” is a microcosm of a larger systemic threat. In a corporate environment, an unexplained service failure could indicate anything from a memory corruption bug being triggered to a ransomware payload encrypting files in the background, or a cryptocurrency miner exhausting CPU cycles. The forensic difference is minimal initially. The immediate priority is containment—isolating the affected system, preserving logs, and analyzing the failure’s root cause with a security-first mindset. Assuming innocence (“it’s just a bug”) without verification can allow a threat actor to maintain persistence within the network. The commands and configurations provided are not just administrative tools; they are the first line of defense in a layered security strategy, enabling teams to detect, diagnose, and defend against instability that has malicious intent.
Prediction:
The convergence of AI workloads with traditional IT infrastructure will create novel attack surfaces. We predict a rise in “instability-as-an-attack-vector,” where threat actors will deliberately induce AI model crashes or resource exhaustion in GPU clusters as a diversion for data exfiltration or to create deniable destruction of evidence. Furthermore, as AI is integrated into security tooling itself, adversarial attacks designed to cause these AI systems to fail or make incorrect decisions will become a primary focus for advanced persistent threats (APTs), making system resilience and explainable AI not just performance metrics but core cybersecurity requirements.
🎯Let’s Practice For Free:
IT/Security Reporter URL:
Reported By: Stephaniezhuang Gottalayoffthecaffeine – Hackers Feeds
Extra Hub: Undercode MoN
Basic Verification: Pass ✅


