Listen to this Post
Introduction:
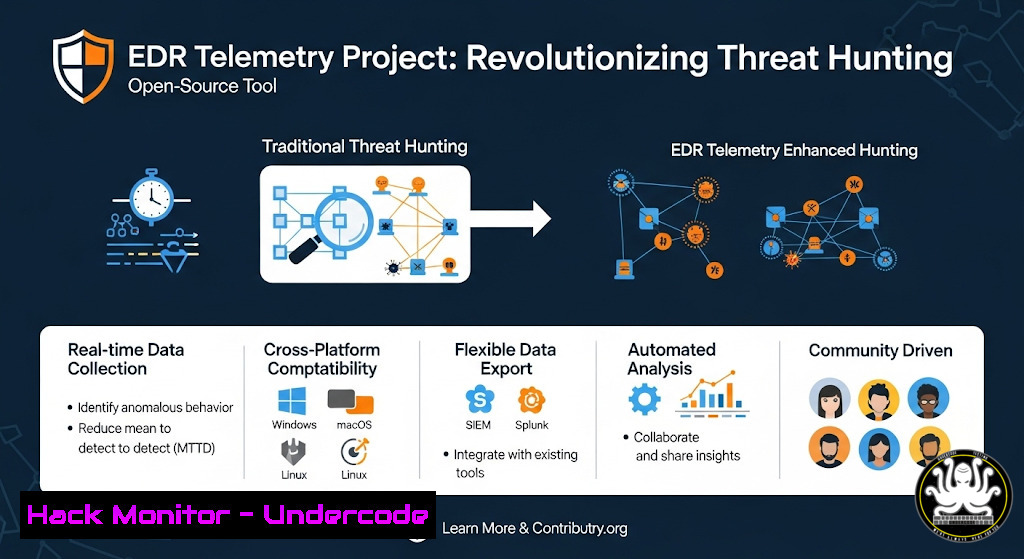
Endpoint Detection and Response (EDR) systems generate vast amounts of telemetry data, but effectively analyzing this data for threat hunting has traditionally been a complex challenge. The EDR Telemetry Project, an independent, non-corporate platform, has emerged as a critical open-source resource, providing security professionals with standardized tools to parse, compare, and hunt through EDR data, significantly improving visibility and detection capabilities across diverse environments.
Learning Objectives:
- Understand the core functionality and purpose of the EDR Telemetry Project for security operations.
- Learn to utilize command-line and scripting techniques to analyze EDR telemetry data effectively.
- Implement practical hunting queries and workflows to identify potential threats within your environment.
You Should Know:
1. Project Overview and Initial Setup
The EDR Telemetry Project, hosted at `https://edr-telemetry.com/`, provides a framework for normalizing and querying data from various EDR vendors. The first step is to clone the project repository from GitHub to your analysis machine.
`git clone https://github.com/TheDFIRReport/edr-telemetry.git`
This command downloads the entire project structure, including parsers, query libraries, and documentation, to your local directory. Navigate into the cloned folder (cd edr-telemetry) to access the tools. The project’s growth (137+ clones, 874 views in 14 days) is a testament to its immediate value for security teams.
2. Ingesting and Normalizing EDR Data
Different EDRs export data in different formats. The project includes scripts to normalize this data into a common schema for analysis. For a JSON log export from a supported EDR, use the provided Python normalizer.
`python3 scripts/normalize_edr_json.py -i input_logs.json -o normalized_output.json`
This command processes the raw input file (input_logs.json) and creates a new file (normalized_output.json) where all events conform to a standardized format. This allows an analyst to write a single hunting query that works across data ingested from CrowdStrike, Microsoft Defender, Elastic, and others.
3. Basic Command-Line Filtering for Process Creation
Once data is normalized, powerful command-line tools like `jq` can be used for initial triage. To filter all process creation events and extract the parent and child process names, use this `jq` query.
`jq ‘select(.event_type == “process_created”) | {parent: .parent_name, child: .process_name}’ normalized_output.json`
This jq filter sifts through the normalized data, selects only process creation events, and outputs a concise JSON object showing the relationship between parent and child processes. This is the first step in hunting for suspicious process chains.
4. Hunting for LOLBIN Execution with jq
Living Off the Land Binaries (LOLBins) are trusted system utilities often abused by attackers. The normalized data makes hunting for their execution straightforward.
`jq ‘select(.event_type == “process_created” and (.process_name | test(“whoami|systeminfo|net.exe|nslookup|powershell”; “i”))) | .process_name’ normalized_output.json | sort | uniq -c | sort -nr`
This complex `jq` command filters for process creation events where the name matches common LOLBins (case-insensitive), extracts the names, and then pipes the result to standard Unix utilities (sort, uniq -c) to count and rank their frequency. A sudden spike in a rarely used LOLBin could indicate malicious activity.
5. Identifying Network Connections to Suspicious Domains
Leveraging threat intelligence, you can hunt for network connections to known-bad domains. First, create a simple text file (ioc_domains.txt) with one domain per line. Then, use `grep` to cross-reference.
`grep -f ioc_domains.txt normalized_output.json | jq ‘. | {timestamp: .timestamp, process: .process_name, destination: .destination_ip}’`
The `grep` command filters the entire JSON file for lines containing any of the IOCs. The resulting lines are still valid JSON, so they are piped to `jq` to extract and format only the most relevant fields for the analyst to investigate.
6. PowerShell Script for Bulk Telemetry Analysis
For analyzing multiple telemetry files, a PowerShell script can automate the process. This script loops through all `.json` files in a directory and runs a core hunting query.
Get-ChildItem -Path "C:\Telemetry.json" | ForEach-Object {
$data = Get-Content $<em>.FullName | ConvertFrom-Json
$suspicious = $data | Where-Object { $</em>.event_type -eq "process_created" -and $<em>.integrity_level -eq "Low" }
if ($suspicious) { Export-Csv -InputObject $suspicious -Path ".\suspicious</em>$($_.Name).csv" -NoTypeInformation }
}
This script loads each JSON file, converts it to a PowerShell object, and filters for processes running with a Low integrity level (a potential indicator of exploitation). If any are found, it exports them to a CSV file for further review.
7. Building a Detection Rule from Telemetry Patterns
The ultimate goal of telemetry analysis is to create robust detections. After identifying a malicious pattern, such as `rundll32.exe` spawning from an Office application, you can codify it into a Sigma rule for deployment across your SIEM.
title: Rundll32 Spawned From Office Product
logsource:
product: windows
category: process_creation
detection:
selection:
ParentImage|endswith:
- '\winword.exe'
- '\excel.exe'
- '\powerpnt.exe'
Image|endswith: '\rundll32.exe'
condition: selection
This YAML-based Sigma rule defines a detection for a specific TTP. The `logsource` defines where to apply it, and the `detection` block specifies the parent-child process relationship that should trigger an alert.
What Undercode Say:
- The organic growth of the EDR Telemetry Project underscores a critical market need: vendor-agnostic, practical tools that cut through the noise of modern EDR platforms.
- This project democratizes advanced threat hunting by providing a free, community-powered framework that was previously only available to large enterprises with dedicated engineering resources.
The success of the EDR Telemetry Project is a direct challenge to the cybersecurity industry’s status quo. It proves that value is not defined by marketing budgets but by utility and adoption by practitioners. The metrics—15k+ monthly views, 2.3k active users, and 7+ pages per session—paint a picture of deeply engaged professionals using the platform as a serious workbench, not just a passive blog. This shift towards open, collaborative, and standardized tooling is essential for closing the gap between attackers and defenders. The project’s focus on comparative telemetry is particularly powerful, as it enables defenders to understand evasion techniques across different platforms, forcing EDR vendors to compete purely on the quality of their visibility and detection logic.
Prediction:
The methodology and community model pioneered by the EDR Telemetry Project will catalyze a broader movement towards open-source, interoperable security telemetry standards. Within two years, we predict that major EDR vendors will be pressured to provide more standardized, granular data exports as a baseline feature to meet customer demand. Furthermore, the project’s approach will become foundational for managed security service providers (MSSPs) who need to hunt across diverse client environments consistently. This will ultimately lead to faster detection engineering cycles and a more transparent, effective security ecosystem, raising the baseline cost and complexity for adversaries.
🎯Let’s Practice For Free:
IT/Security Reporter URL:
Reported By: Kostastsale Edr – Hackers Feeds
Extra Hub: Undercode MoN
Basic Verification: Pass ✅


