
Listen to this Post
Introduction:
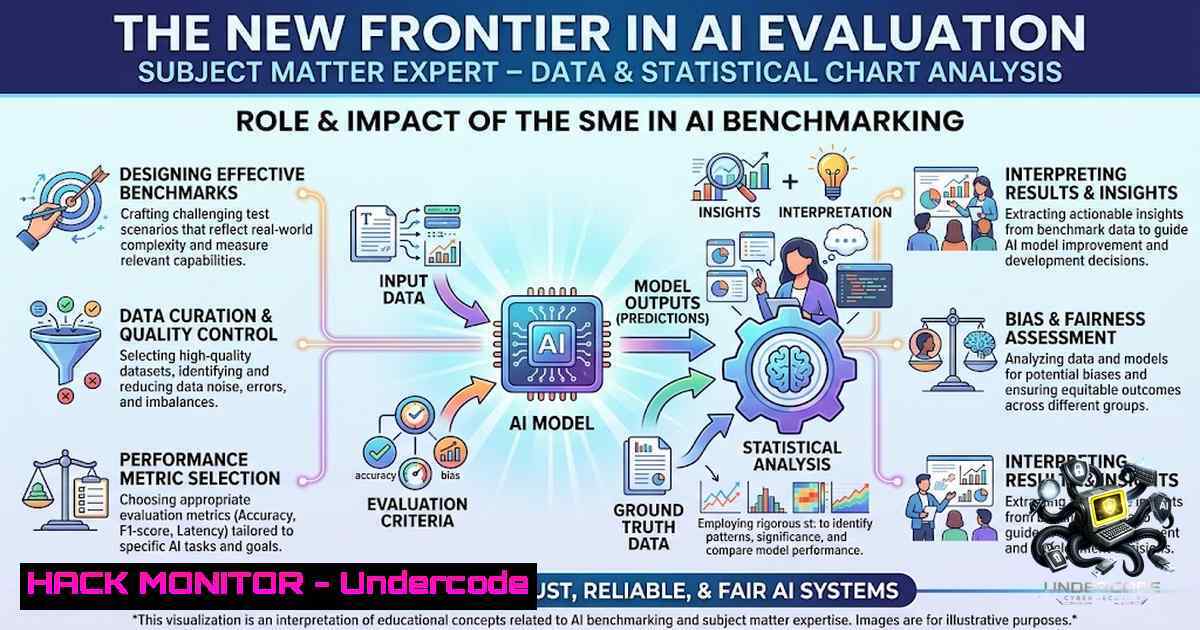
The rapid advancement of large language models (LLMs) and multimodal AI systems has exposed a critical bottleneck: the lack of robust, high-quality benchmarks to accurately measure their reasoning capabilities. As frontier models saturate existing chart understanding benchmarks—scoring 80–90% on standard bar, line, and pie chart tasks—the industry is turning to domain experts to build the next generation of evaluation frameworks. The recent surge in hiring for Subject Matter Experts in Data & Statistical Chart Analysis for AI Benchmarking (with 50 openings at $25–$50/hour) signals a fundamental shift: AI evaluation is no longer just a software engineering problem—it is a statistical, domain-expertise problem that requires professionals who can interpret complex visualizations, design rigorous analytical tasks, and validate AI outputs against expert-defined criteria.
Learning Objectives & Secrets:
- Objective 1: Master Advanced Chart Interpretation for AI Evaluation – Develop proficiency in interpreting complex statistical visualizations beyond basic chart types, including Sankey diagrams, heatmaps, calibration curves, residual plots, correlation matrices, and distribution plots. The secret lies not just in reading the chart, but in understanding the domain conventions, statistical annotations, and implicit reasoning required to evaluate AI-generated responses against expert benchmarks.
-
Objective 2 (Secret Tip): Design Unambiguous Multi-Step Analytical Tasks – Create objective, multi-step questions that require quantitative reasoning beyond surface-level chart reading. The secret is to structure tasks that force the AI to perform explicit calculations, statistical inferences, or modeling logic, while avoiding ambiguous or subjective prompts. Always include step-by-step written explanations with explicit calculations.
-
Objective 3 (Secret Tip): Validate AI Outputs with Statistical Rigor – Consistently produce objectively verifiable tasks and solutions. The secret is to establish expert-set acceptable ranges for numerical answers, allowing for genuine chart reading rather than pixel-perfect luck. This approach, used in benchmarks like Chartography, enables grading that rewards genuine understanding rather than rote memorization.
You Should Know:
- Benchmark Saturation and the Need for Expert-Crafted Evaluation
The current state of AI chart understanding reveals a troubling trend: existing benchmarks are dominated by simple bar, line, and pie charts, rely on shorter reasoning chains, and are nearing saturation. The Chartography benchmark, released in August 2026, addresses this by introducing 100 tasks featuring professional-grade charts from 12 domains including Finance, Healthcare, and STEM fields. In evaluations of 30 frontier-model configurations, the best configuration reached only 45.0% mean pass@1, with failures concentrated in visual perception—models miss nuanced features, misread values along sparsely labeled axes, and violate domain conventions.
This gap between human expertise and AI performance is precisely why the role of Subject Matter Expert is critical. Professionals with backgrounds in statistics, data science, and quantitative research are now essential for creating benchmarks that genuinely test AI capabilities. The job description explicitly notes that “no prior experience in AI is required—your domain knowledge is what matters”, underscoring that statistical and analytical expertise is the稀缺 commodity.
Step-by-Step Guide: Building a Professional-Grade AI Benchmark Dataset
- Select Domain-Specific Charts: Choose charts from professional practice that represent real-world decision-making contexts—Sankey diagrams for flow analysis, candlestick charts for financial data, contour maps for geospatial analysis.
-
Draft Expert Questions: Have working professionals in the relevant field write questions that require multi-step reasoning. Each question should demand graphical reasoning, trend analysis, comparison, interpolation, or statistical inference.
-
Verify with Multiple Experts: Each task should be independently verified by at least three additional experts to ensure clarity and correctness.
-
Define Acceptable Ranges: For numerical answers, set expert-acceptable ranges (e.g., “150 mph, acceptable 140–150 mph”) to account for reasonable interpretation variance.
-
Create Explicit Walkthroughs: Authors should submit detailed calculation paths for each answer, documenting the reasoning process.
-
Implement Contamination Controls: Include canary GUIDs in the dataset to detect if the benchmark data appears in training corpora, and explicitly mark the data as “evaluation use only—do not train on this data”.
2. Statistical Modeling for Robust AI Benchmarking
The National Institute of Standards and Technology (NIST) has published research demonstrating how generalized linear mixed models (GLMMs) can produce correct estimates of generalized accuracy while more efficiently quantifying uncertainty compared to existing regression-free approaches. This statistical framework enables evaluators to decompose variance, estimate item difficulty, and illuminate important aspects of LLM performance and benchmark construction.
For Subject Matter Experts, this means that benchmark design is not just about creating questions—it’s about creating a statistically valid measurement instrument. The work involves designing tasks that can be analyzed using these advanced statistical models to produce reliable performance metrics.
Step-by-Step Guide: Applying GLMMs to AI Benchmark Analysis
- Collect Performance Data: Run your benchmark tasks across multiple AI models, collecting pass/fail or score data for each task-item combination.
-
Define the Statistical Model: Specify a generalized linear mixed model with:
– Fixed effects for model type and task characteristics
– Random effects for item difficulty and model-specific variability
- Fit the Model: Use statistical software (R with lme4, or Python with statsmodels) to fit the model to your data.
-
Estimate Generalized Accuracy: Compute predictions for performance on all potential test items similar to those in your benchmark, not just the fixed set.
-
Quantify Uncertainty: Use the model to produce confidence intervals that accurately reflect the uncertainty in your performance estimates.
-
Interpret Variance Components: Decompose the variance to understand how much of the performance variation is due to model differences versus task difficulty.
Example R Code for GLMM Analysis:
library(lme4)
 Assuming data frame with columns: model, task_id, correct (0/1)
model <- glmer(correct ~ model_type + (1 | task_id) + (1 | model),
data = benchmark_data, family = binomial)
summary(model)
 Estimate generalized accuracy for each model
predictions <- predict(model, newdata = new_data, type = "response")
- Data Quality Assurance in AI Training and Evaluation
The quality of training data directly impacts AI performance. Research from MIT’s ChartNet dataset highlights that a key limitation in current AI systems is the lack of large, high-quality training data for robust chart interpretation. For Subject Matter Experts, this means that their work in creating high-quality benchmark tasks also serves as a model for how training data should be structured.
Data quality assurance involves multiple stages: sampling, collection, annotation, and processing. Each stage requires careful attention to avoid introducing biases or errors that could compromise the AI’s learning or evaluation.
Step-by-Step Guide: Implementing Data Quality Assurance for AI Chart Datasets
- Sampling: Ensure your chart samples represent the full diversity of chart types and domains relevant to your application.
-
Collection: Source charts from professional practice, ensuring proper licensing and attribution.
-
Annotation: Use domain experts to annotate charts with:
– Accurate labels for axes, legends, and units
– Statistical annotations (confidence intervals, p-values)
– Domain-specific conventions
- Validation: Implement a validation pipeline that checks for:
– Consistency in annotations across annotators
– Correctness of numerical values
– Absence of ambiguity in questions and answers
- Verification: Use automated verification where possible, such as symbolic equivalence checking for mathematical expressions.
-
Human Review: Conduct manual investigations to validate the reliability of automated checks.
Example Python Code for Data Validation:
import pandas as pd
import numpy as np

def validate_chart_annotations(df):
"""Validate chart annotation consistency."""
 Check for missing values
assert df['axes_labels'].notna().all(), "Missing axis labels"
 Check numerical ranges
assert df['values'].between(df['min_acceptable'], df['max_acceptable']).all(), \
"Values outside acceptable range"
 Check for duplicates
assert not df.duplicated(subset=['chart_id', 'question']).any(), \
"Duplicate questions for same chart"
return True
- The Role of Python and R in AI Benchmarking
The job posting explicitly highlights Python/R skills as valuable for candidates. These languages are essential for statistical analysis, data visualization, and AI benchmarking. Python dominates general-purpose AI and production ML, while R excels in statistical modeling, visualization, and research.
For Subject Matter Experts, proficiency in these tools enables them to:
– Analyze benchmark results statistically
– Create data visualizations for reporting
– Develop automated validation scripts
– Implement statistical models for performance evaluation
Step-by-Step Guide: Setting Up a Python Environment for AI Benchmark Analysis
1. Install Python and Required Packages:
 On Linux/macOS
python3 -m pip install pandas numpy matplotlib seaborn scipy statsmodels

On Windows (using PowerShell)
python -m pip install pandas numpy matplotlib seaborn scipy statsmodels
2. Load Benchmark Data:
import pandas as pd
import numpy as np
import matplotlib.pyplot as plt
import seaborn as sns

Load benchmark results
df = pd.read_csv('benchmark_results.csv')
3. Calculate Performance Metrics:
 Calculate accuracy by model and task type
accuracy_by_model = df.groupby('model')['correct'].mean()
accuracy_by_task = df.groupby('task_type')['correct'].mean()
4. Visualize Results:
 Create a heatmap of model performance by task type
pivot = df.pivot_table(index='model', columns='task_type', values='correct', aggfunc='mean')
plt.figure(figsize=(12, 8))
sns.heatmap(pivot, annot=True, cmap='coolwarm', vmin=0, vmax=1)
plt.title('Model Performance by Task Type')
plt.show()
5. Perform Statistical Tests:
from scipy import stats
 Compare two models
t_stat, p_value = stats.ttest_ind(df[df['model']=='ModelA']['correct'],
df[df['model']=='ModelB']['correct'])
print(f"t-statistic: {t_stat}, p-value: {p_value}")
5. Cloud Data Warehouse Integration for AI Evaluation
Micro1 is also engaging Data Analysts for projects evaluating AI assistants in real-world analytical workflows leveraging cloud data warehouses. This involves executing structured evaluation tasks simulating typical analytical workflows, such as anomaly investigation, and independently verifying AI-generated figures against source data by writing and running SQL queries.
For Subject Matter Experts, understanding cloud data warehouse connectivity and SQL is increasingly important, as AI systems are being evaluated on their ability to perform real-world data analysis tasks.
Step-by-Step Guide: SQL-Based AI Output Verification
1. Connect to Cloud Data Warehouse:
-- Example: BigQuery connection setup
-- Use appropriate client libraries for your cloud provider
2. Write Verification Queries:
-- Verify AI-generated aggregate against source data
SELECT
COUNT() as total_records,
AVG(sales_amount) as avg_sales,
SUM(sales_amount) as total_sales
FROM sales_transactions
WHERE transaction_date BETWEEN '2026-01-01' AND '2026-12-31';
3. Compare AI Outputs:
-- Compare AI-generated summary against actual data
WITH ai_summary AS (
SELECT 'AI generated summary' as source, 150000 as total_sales
),
actual_summary AS (
SELECT 'Actual data' as source, SUM(sales_amount) as total_sales
FROM sales_transactions
)
SELECT  FROM ai_summary
UNION ALL
SELECT  FROM actual_summary;
- Document Discrepancies: Record any differences between AI-generated figures and verified source data, noting the specific joins, filters, and time windows used.
What Undercode Say:
- Key Takeaway 1: The hiring of 50 Subject Matter Experts for AI benchmarking represents a paradigm shift in AI evaluation—moving from automated metrics to human-expert-validated benchmarks that test genuine reasoning rather than pattern matching. The Chartography benchmark’s finding that frontier models score only 45% on professional-grade charts underscores the massive gap between current AI capabilities and human expert performance.
-
Key Takeaway 2: The role demands not just statistical knowledge but the ability to design unambiguous, multi-step analytical tasks—a skill that combines pedagogy, domain expertise, and rigorous quality assurance. The emphasis on “no prior AI experience required” signals that deep domain knowledge in statistics and data analysis is the primary qualification, with AI expertise being secondary.
Analysis: This job posting reveals a critical inflection point in the AI industry. As models approach saturation on existing benchmarks, the industry must create more challenging, professionally-grounded evaluation frameworks. The involvement of NIST in publishing statistical methodologies for AI benchmarking indicates that this is becoming a formalized scientific discipline. For data scientists and statisticians, this represents a unique opportunity to shape how AI capabilities are measured and validated. The compensation range of $25–$50/hour reflects the high value placed on this expertise, and the remote, global nature of the roles opens opportunities for professionals worldwide.
Prediction:
- +1 The demand for Subject Matter Experts in AI benchmarking will grow exponentially over the next 2–3 years, creating a new career track for data scientists and statisticians. This will lead to the emergence of “AI Evaluation Engineer” as a distinct profession, with dedicated training programs and certifications.
-
+1 Benchmark quality will become a competitive differentiator for AI companies, with organizations investing heavily in expert-crafted evaluation datasets. This will drive the development of new tools and platforms for benchmark creation and management.
-
-1 The reliance on human experts for benchmarking may create bottlenecks in AI development, as the supply of qualified experts may not keep pace with the rapid release of new models. This could lead to a “evaluation gap” where models are deployed without adequate testing.
-
+1 Statistical modeling approaches like GLMMs will become standard practice in AI evaluation, leading to more accurate and reliable performance comparisons. This will reduce the noise in benchmark results and provide clearer signals for model improvement.
-
-1 The risk of benchmark contamination will increase as more datasets are published, requiring robust detection mechanisms like canary GUIDs. Organizations that fail to implement contamination controls may produce misleading performance claims.
-
+1 The integration of cloud data warehouse evaluation tasks will accelerate the development of AI assistants capable of performing real-world analytical workflows, potentially transforming how data analysis is conducted across industries.
-
-1 The high barrier to entry for creating professional-grade benchmarks may concentrate evaluation capability in a few organizations, potentially limiting the diversity of perspectives in AI assessment.
▶️ Related Video (74% Match):
https://www.youtube.com/watch?v=1YcHq00uyPk
🎯Let’s Practice For Free:
🎓 Live Courses & Certifications:
Join Undercode Academy for Verified Certifications
🚀 Request a Custom Project:
Secure, high-velocity infrastructure and disruptive technological engineering. Contact our engineering team for high-tier development and proprietary systems:
[email protected]
💎 Smart Architecture | 🛡️ Secure by Design | ⭐ Trusted by Thousands
IT/Security Reporter URL:
Reported By: https://lnkd.in/p/eGszimVn – Hackers Feeds
Extra Hub: Undercode MoN
Basic Verification: Pass ✅


