Listen to this Post
Introduction:
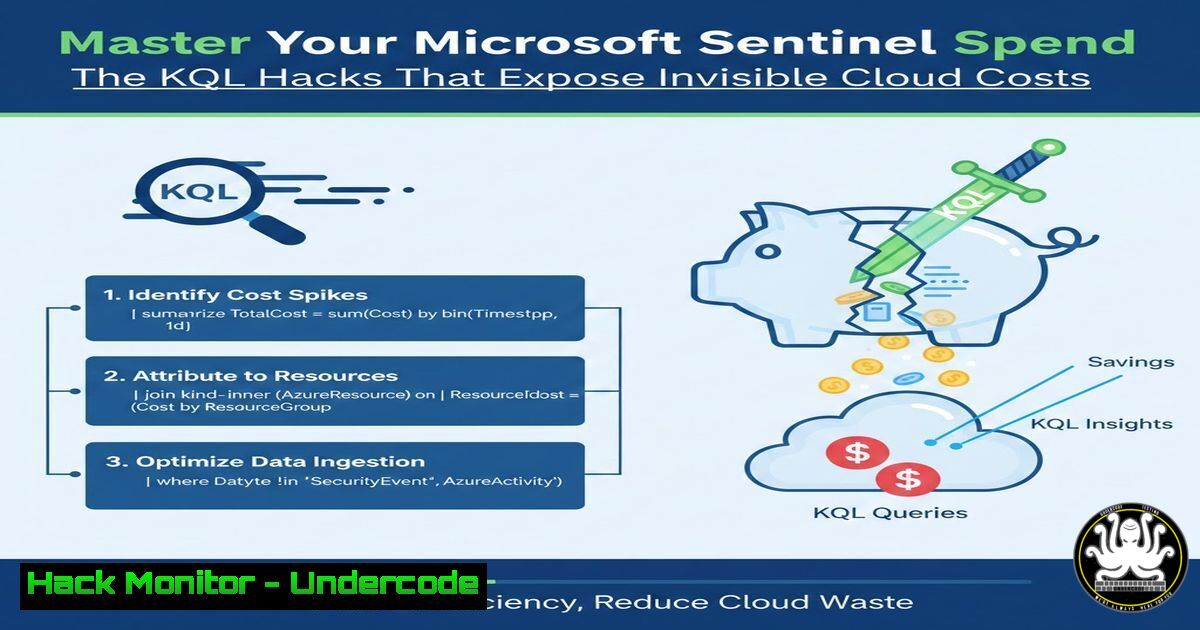
In the world of cloud-native security, Microsoft Sentinel provides unparalleled threat visibility, but its pay-per-gigabyte ingestion model can lead to unpredictable and soaring costs. Security teams are often blindsided by monthly bills, struggling to answer the fundamental question: “What is generating this cost, and is it worth it?” Ian Hanley’s inaugural “KQL Toolbox” post delivers the essential scripts and methodology to transform cost data into actionable intelligence, empowering teams to govern their SIEM spend without sacrificing security coverage.
Learning Objectives:
- Construct and execute KQL queries to dissect Microsoft Sentinel billable ingest by table, source, and time.
- Translate raw data volume (GB/GiB) into accurate financial cost projections for budgeting and reporting.
- Implement a continuous cost monitoring dashboard to identify trends, anomalies, and optimization opportunities.
You Should Know:
1. Understanding the Core Data: The `Usage` Table
The foundation of all Sentinel cost analysis is the `Usage` table. It logs the volume of data ingested into each specific table (like SecurityEvent, CommonSecurityLog, or Heartbeat) within your Log Analytics workspace.
Step‑by‑step guide:
- Access Log Analytics: Navigate to your Sentinel workspace in the Azure portal and select “Logs” from the monitoring section.
- Run a Basic Query: Start by exploring the data schema and volume over a recent period.
// Explore the Usage table structure and sample data
Usage
| where TimeGenerated >= ago(7d)
| take 100
| project TimeGenerated, DataType, Quantity, QuantityUnit, IsBillable
- Interpret the Output: The key columns are `DataType` (the destination log table), `Quantity` (the amount ingested), and
IsBillable. Filtering for `IsBillable == true` is crucial, as not all ingested data (like some Azure diagnostic data) incurs a charge.
2. Calculating Daily & Monthly Billable Ingest
To track costs, you must aggregate the billable data. A common pitfall is confusing Gigabytes (GB – decimal) for Gibibytes (GiB – binary). Azure billing uses GB (decimal). The `QuantityUnit` field confirms the unit.
Step‑by‑step guide:
// Calculate daily billable ingest in GB
Usage
| where TimeGenerated >= ago(30d)
| where IsBillable == true
// Ensure we sum only GB units; some rows may be in MB
| where QuantityUnit == "GBytes"
| summarize TotalBillableGB = sum(Quantity) by DataType, bin(TimeGenerated, 1d)
| render columnchart // Visualize the trend
This query provides a daily breakdown, showing which log table (DataType) drove costs on any given day, forming the basis for trend analysis.
3. Attributing Cost to Specific Data Sources
Knowing the cost per table is good, but you need to trace it back to the source system (e.g., a specific firewall or server). This requires joining the `Usage` table with the `AzureDiagnostics` or other relevant logs.
Step‑by‑step guide:
// Correlate billable ingest with its source (Example for Azure Firewall)
let UsageData = Usage
| where TimeGenerated >= ago(1d)
| where IsBillable == true and DataType == "AzureDiagnostics"
| summarize IngestGB = sum(Quantity) by Resource;
AzureDiagnostics
| where TimeGenerated >= ago(1d)
| where Resource in (UsageData)
| summarize EventCount = count() by Resource, Category
| join kind=inner (UsageData) on Resource
| project Resource, Category, EventCount, IngestGB
| order by IngestGB desc
This helps identify if, for example, a single misconfigured Azure Firewall is logging excessive network rule hits, generating disproportionate cost.
4. Building a Cost Projection Dashboard
Static reports are not enough. Building a reusable dashboard in Sentinel allows for real-time cost governance.
Step‑by‑step guide:
- Create a Cost Query: Develop a comprehensive query that projects monthly spend based on recent trends.
// Project monthly cost (assuming $X per GB)
let PricePerGB = 2.5; // Replace with your actual tier price
Usage
| where TimeGenerated >= ago(7d)
| where IsBillable == true and QuantityUnit == "GBytes"
| summarize TotalGB = sum(Quantity)
| project Last7DaysGB = TotalGB,
ProjectedMonthGB = TotalGB  (30 / 7),
EstimatedCost = TotalGB  (30 / 7)  PricePerGB
- Pin to Dashboard: After running the query, click “Pin to dashboard” and select an existing or new Azure dashboard.
- Add Visualizations: Combine this with a time-chart of daily ingest and a top-10 list of data sources to create a complete cost monitoring view.
5. Proactive Optimization with Alert Rules
Use Sentinel’s alerting capability to trigger notifications when ingest patterns deviate from the norm, indicating potential configuration errors or attacks.
Step‑by‑step guide:
- Create an Analytics Rule: In Sentinel, go to Analytics and create a new “Scheduled query rule.”
2. Define the Rule Logic:
// Alert on a sudden spike in billable ingest
let baseline = toscalar(
Usage
| where TimeGenerated between (ago(3d)..ago(2d))
| where IsBillable == true
| summarize avg(Quantity)
);
Usage
| where TimeGenerated > ago(1d)
| where IsBillable == true
| summarize TodayIngest = sum(Quantity)
| where TodayIngest > baseline  1.5 // Alert if 50% above baseline
3. Configure Actions: Set the alert severity and configure email or Teams notifications for the SOC team.
6. Complementary PowerShell Audit for Holistic Governance
While KQL manages Sentinel data, your overall Azure governance impacts cost. Use PowerShell to audit RBAC and resource configurations that drive logging. This script, inspired by DevSecOpsDad’s toolbox, audits privileged roles.
Step‑by‑step guide:
 Connect to Azure
Connect-AzAccount
 Get all users with the "Owner" role at subscription scope
$subscriptionId = (Get-AzContext).Subscription.Id
$owners = Get-AzRoleAssignment -Scope "/subscriptions/$subscriptionId" `
-RoleDefinitionName "Owner" `
-IncludeClassicAdministrators
 Display results
$owners | Select-Object DisplayName, UserPrincipalName, ObjectType | Format-Table
Excessive owners can lead to uncoordinated resource deployments, indirectly inflating Sentinel costs.
7. Exporting Group Policy for Security Baseline Correlation
For hybrid environments, understanding on-premises Group Policy is key. Changes in GPOs can cause log avalanches. This PowerShell script exports all GPOs for offline review.
Step‑by‑step guide:
 Requires GroupPolicy Module
Get-Module -ListAvailable GroupPolicy | Import-Module
 Get all GPOs
$allGPOs = Get-GPO -All
 Create an HTML report
$reportPath = "C:\Audit\GPO_Report_$(Get-Date -Format 'yyyyMMdd').html"
$allGPOs | Get-GPOReport -ReportType Html | Out-File -FilePath $reportPath
Write-Host "GPO report generated: $reportPath"
Reviewing this report helps identify GPOs that might be enabling verbose, costly logging (like enabling Process Creation Auditing on all servers) and allows for precise tuning.
What Undercode Say:
- Key Takeaway 1: Cost Visibility is the First Pillar of FinOps for Security. You cannot manage or defend what you cannot measure. The techniques outlined shift Sentinel costs from an opaque, unpredictable tax to a transparent, attributeable, and manageable security investment. This is not just about saving money—it’s about ensuring budget is allocated to high-value security logs rather than waste.
- Key Takeaway 2: KQL is the Universal Key to Unlock SIEM Value. Beyond threat hunting, KQL is a critical administrative and financial tool for the modern SecOps team. Mastering these cost-optimization queries builds the same muscle memory used for incident response, creating a team that is both fiscally responsible and technically adept.
The analysis reveals a maturation in cloud security practice: operational efficiency is now inseparable from technical efficacy. By applying these queries, security architects transform from passive consumers of a service to active governors of their security data ecosystem. This proactive stance prevents difficult conversations with leadership during budget reviews and instead fosters discussions about strategic investment in security tools. Ultimately, this discipline ensures that financial resources are preserved for enhancing detection capabilities, rather than being consumed by inefficiency.
Prediction:
The necessity for granular security cost management will accelerate the development of automated ingestion governance platforms. Future iterations of tools like Microsoft Sentinel will likely embed AI-driven cost anomaly detection and automated tuning recommendations directly into the SIEM interface. We will see a convergence of Security Orchestration, Automation, and Response (SOAR) principles with financial operations (FinOps), where playbooks will not only contain steps to isolate a compromised host but also to automatically adjust its log verbosity to contain cost during an incident. The role of the security engineer will evolve to include “log economics” as a core competency, balancing threat visibility against operational expenditure in real-time.
▶️ Related Video (82% Match):
🎯Let’s Practice For Free:
IT/Security Reporter URL:
Reported By: Ianhanley Kql – Hackers Feeds
Extra Hub: Undercode MoN
Basic Verification: Pass ✅


