Listen to this Post
Introduction:
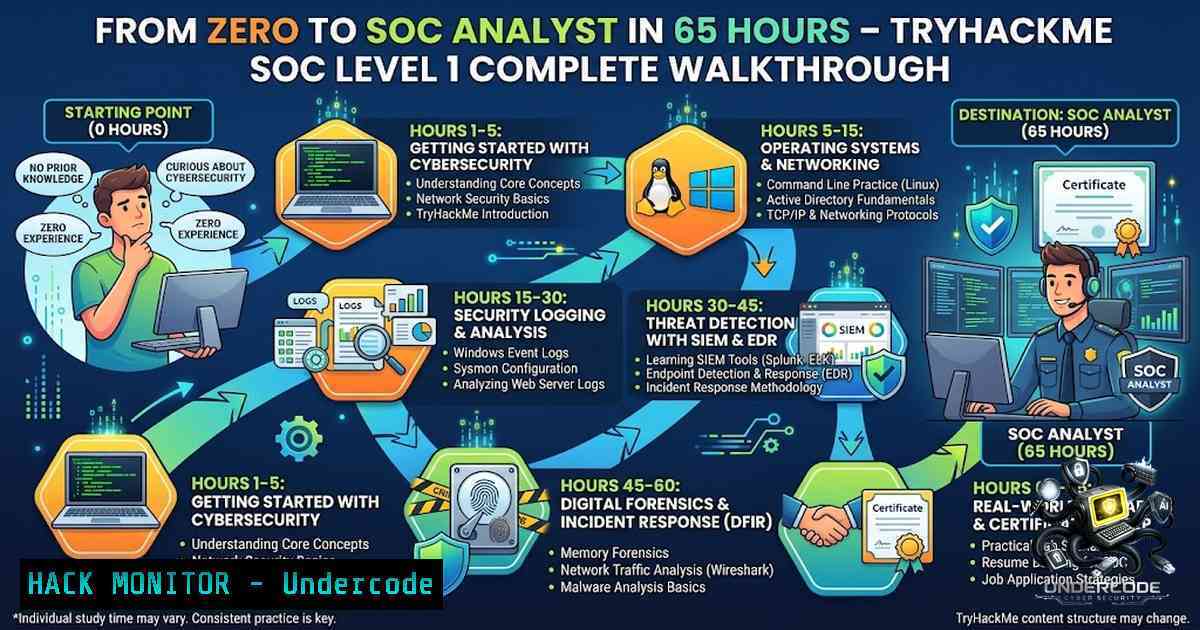
The Security Operations Center (SOC) is the nerve center of modern enterprise defense, where junior analysts serve as the first line of detection against cyber threats. TryHackMe’s SOC Level 1 learning path – a 65‑hour, 14‑module intensive program – bridges the critical gap between theoretical cybersecurity knowledge and practical, hands‑on defensive operations. This article breaks down every core competency covered in the path, from MITRE ATT&CK mapping to SIEM triage, and provides actionable commands and configurations you can use to build your own SOC analyst skillset.
Learning Objectives:
- Master cyber defense frameworks including MITRE ATT&CK, Cyber Kill Chain, and Pyramid of Pain to structure threat detection and incident response.
- Develop proficiency in SIEM platforms (Splunk and Elastic Stack) for log ingestion, correlation, and alert triage.
- Acquire hands‑on network traffic analysis skills using Wireshark, Snort, and Zeek to detect anomalies and malicious activity.
- Build foundational knowledge in endpoint monitoring, digital forensics, and threat intelligence to investigate and respond to real‑world incidents.
- Cyber Defense Frameworks: The Blue Team’s Strategic Compass
Every SOC analyst must understand the adversary’s playbook. The path dedicates significant time to frameworks that structure how we think about attacks and defenses.
The Cyber Kill Chain breaks an intrusion into seven phases – from reconnaissance to actions on objectives. Defenders can detect and disrupt attacks early by monitoring for indicators at each stage. For example, an unusual number of outbound connections on port 445 may indicate lateral movement (phase 6), while unexpected scheduled tasks could signal persistence (phase 5).
The MITRE ATT&CK framework goes further, providing a detailed knowledge base of adversary tactics, techniques, and procedures (TTPs). Rather than just knowing a virus exists, MITRE tells you the specific steps an attacker takes from initial access to data exfiltration. The path also introduces the Pyramid of Pain, which ranks indicators of compromise (IOCs) by how difficult they are for attackers to change – hashes are easiest to alter, while TTPs are the hardest and most valuable to detect.
Step‑by‑step: Applying MITRE ATT&CK in an Investigation
- Identify a suspicious alert (e.g., unusual PowerShell execution).
- Open the MITRE ATT&CK Navigator (https://mitre-attack.github.io/attack-1avigator/) and search for “PowerShell”.
- Map the activity to a technique (e.g., T1059.001 – Command and Scripting Interpreter).
- Review the technique’s mitigation and detection sections to guide your response.
- Document the TTP in your incident report for future threat hunting.
-
SIEM Fundamentals: Splunk and Elastic Stack in Action
SIEM (Security Information and Event Management) is the analyst’s primary dashboard. The path provides hands‑on experience with both commercial and open‑source SIEM solutions.
Splunk architecture revolves around three core components: Forwarder (data collection), Indexer (data storage and processing), and Search Head (query interface). You learn to ingest custom log data, create field extractions, and use the Search Processing Language (SPL) to filter and correlate events.
Elastic SIEM (ELK Stack) offers similar capabilities with a focus on scalability and visualization. Both platforms require understanding of log sources – Windows Event Logs, Linux audit logs, firewall logs, and application logs – and how to normalize them for correlation.
Step‑by‑step: Basic SIEM Triage with Splunk SPL
- Search for a specific user activity: `index=windows_logs user=john.doe | table _time, event_id, source, message`
2. Identify failed logon attempts: `index=windows_logs EventCode=4625 | stats count by src_ip, user | sort – count`
3. Correlate across sources (e.g., IIS + Suricata): `index=iis_logs status=404 | join src_ip [search index=suricata alert.signature=]`
4. Create an alert for brute‑force patterns: `index=windows_logs EventCode=4625 | stats count by src_ip, user | where count > 10`
5. Save the search as a dashboard panel for continuous monitoring.
3. Network Traffic Analysis: Wireshark, Snort, and Zeek
Network traffic holds the most direct evidence of an attack in progress. The path covers three industry‑standard tools for capturing, inspecting, and alerting on network data.
Wireshark is used for deep packet inspection. Analysts learn to filter for specific TCP flags to detect port scans, identify ARP spoofing, and extract malicious payloads.
Snort operates as a rule‑based intrusion detection/prevention system (IDS/IPS). It can run as a sniffer, packet logger, or inline IPS. Rules are written to match on packet signatures and trigger alerts.
Zeek (formerly Bro) is a network security monitor that focuses on generating rich logs (HTTP, DNS, SMTP, etc.) rather than just alerting on signatures.
Step‑by‑step: Detecting a Port Scan with Wireshark
- Capture live traffic: `sudo tshark -i eth0 -w scan.pcap`
2. Apply a filter for SYN packets with window size ≤ 1024 (typical of SYN scans): `tcp.flags.syn==1 and tcp.flags.ack==0 and tcp.window_size <= 1024` 3. Identify the source IP and count unique destination ports: `Statistics → Endpoints → IPv4 → select source → Protocol Hierarchy` 4. Export the suspicious IP list for further investigation.
Step‑by‑step: Running Snort in IDS Mode
1. Test configuration: `sudo snort -c /etc/snort/snort.conf -T`
- Start Snort in IDS mode on interface eth0: `sudo snort -c /etc/snort/snort.conf -i eth0 -A console`
3. Read a pcap file with rules and limit output: `sudo snort -c /etc/snort/snort.conf -q -r suspicious.pcap -A console -1 10`
4. For inline IPS (drop packets): `sudo snort -c /etc/snort/snort.conf -q -Q –daq afpacket -i eth0:eth1 -A console`
4. Endpoint Monitoring and Windows/Linux Forensics
Endpoints are where attacks manifest. The path teaches monitoring of both Windows and Linux systems using native logging and specialized tools.
Windows Event Logs are critical – Event ID 4625 (failed logon), 4624 (successful logon), 4688 (process creation), and 7045 (service installation) are among the most frequently investigated. Sysmon provides additional detailed logging of process creation, network connections, and file changes.
Linux auditing relies on `auditd` and system logs. The path covers parsing `/var/log/auth.log` for SSH failures, `/var/log/syslog` for system events, and using `osquery` for SQL‑based endpoint queries.
Step‑by‑step: Investigating a Suspicious Process on Windows
- Open Event Viewer → Windows Logs → Security.
2. Filter for Event ID 4688 (Process Creation).
- Look for processes launched from unusual locations (e.g., `C:\Users\Public\` or
C:\Windows\Temp\). - Check the command line arguments for obfuscated scripts (e.g.,
powershell -enc).
5. Cross‑reference the process hash with VirusTotal.
- Use Sysmon to trace network connections made by the process: `Event ID 3` (Network connection) filtered by `Image` path.
Step‑by‑step: Linux Log Analysis with Auditd
- Install auditd: `sudo apt install auditd audispd-plugins` (Debian/Ubuntu)
- Add a rule to monitor `/etc/passwd` changes: `sudo auditctl -w /etc/passwd -p wa -k passwd_changes`
3. Search the audit log for the keyword: `sudo ausearch -k passwd_changes`
4. For SSH brute‑force detection: `sudo grep “Failed password” /var/log/auth.log | awk ‘{print $11}’ | sort | uniq -c | sort -1r`
5. Threat Intelligence: From Data to Actionable Insight
Threat intelligence transforms raw indicators into actionable defense. The path covers the intelligence lifecycle – collection, processing, analysis, and dissemination.
Analysts learn to use platforms like MISP (Malware Information Sharing Platform) and OpenCTI for storing and sharing threat data. Tools like Urlscan.io and Abuse.ch help track malicious domains and malware families. YARA rules enable pattern‑based detection of malware families.
Step‑by‑step: Creating a YARA Rule for Malware Detection
- Identify a unique string or byte sequence from a malware sample (e.g., “MALWARE_SIGNATURE”).
2. Write a basic YARA rule:
rule MalwareDetect {
meta:
description = "Detects sample malware"
author = "SOC Analyst"
strings:
$sig = "MALWARE_SIGNATURE"
condition:
$sig
}
3. Test the rule against a file: `yara -r MalwareDetect.yar /path/to/suspicious/`
4. Integrate the rule into your SIEM or EDR for automated detection.
6. Incident Response and Digital Forensics
When an incident occurs, speed and methodical analysis matter. The path covers the incident response lifecycle – preparation, identification, containment, eradication, recovery, and lessons learned.
Digital forensics tools introduced include Autopsy (disk forensics), Volatility (memory analysis), KAPE (artifact collection), and Redline (endpoint investigation). Analysts learn to collect forensic artifacts from both Windows (MFT, registry hives, event logs) and Linux (bash history, system logs, process lists).
Step‑by‑step: Memory Analysis with Volatility
1. Identify the profile: `volatility -f memory.dump imageinfo`
- List running processes: `volatility -f memory.dump –profile=Win10x64_19041 pslist`
3. Check for hidden processes: `volatility -f memory.dump –profile=Win10x64_19041 psscan`
4. Dump a suspicious process: `volatility -f memory.dump –profile=Win10x64_19041 procdump -p [bash] -D ./`
5. Extract network connections: `volatility -f memory.dump –profile=Win10x64_19041 netscan`
6. Scan for malware signatures: `volatility -f memory.dump –profile=Win10x64_19041 malfind`
7. Capstone Challenges: Putting It All Together
The path culminates in capstone scenarios that simulate real SOC investigations. Analysts are given a mix of artifacts – memory dumps, email samples, packet captures, and event logs – and must piece together the attack chain from initial access to data exfiltration. This tests the ability to navigate multiple data sources within a SIEM, correlate findings, and produce a coherent incident report.
Step‑by‑step: Approaching a Capstone Investigation
- Initial Triage: Review the alert that triggered the investigation. Note the time, source IP, and affected host.
- Log Analysis: Query the SIEM for all events related to the source IP and host within the timeframe.
- Network Review: Open the provided PCAP in Wireshark. Filter for traffic to/from the suspicious IP. Look for C2 patterns (e.g., periodic beacons, DNS queries to rare domains).
- Endpoint Forensics: Examine the memory dump with Volatility. Identify any injected processes or unusual network connections.
- Correlate: Map the findings to MITRE ATT&CK techniques. Identify the kill chain phase for each action.
- Report: Document the timeline, affected assets, TTPs used, and recommended remediation steps.
What Undercode Say:
- Key Takeaway 1: The SOC Level 1 path is not just theory – it’s a rigorous, hands‑on simulation of real analyst work. Completing it builds practical, interview‑ready skills in SIEM, network analysis, and incident response.
- Key Takeaway 2: Mastering frameworks like MITRE ATT&CK and Cyber Kill Chain transforms you from a reactive alert‑chaser into a proactive threat hunter who understands adversary behavior.
Analysis: The path’s 65‑hour commitment is substantial but justified by the breadth of coverage. Graduates emerge with proficiency in both commercial (Splunk) and open‑source (ELK, Snort, Zeek) tools, making them adaptable to any SOC environment. The inclusion of forensic tools like Volatility and Autopsy provides a solid foundation for tier‑2 escalation. However, the path’s “easy” difficulty rating may understate the cognitive load – true mastery requires repeated practice beyond the lab exercises. The SAL1 certification adds credential value, but the real payoff is the demonstrable skill set that directly translates to job readiness.
Prediction:
- +1 Demand for SOC analysts will continue to outpace supply, making credentials like TryHackMe’s SAL1 a differentiator in entry‑level hiring.
- +1 The shift toward SIEM‑as‑a‑service and cloud‑native detection will increase the value of analysts who understand both on‑premise and cloud log sources.
- +1 AI‑assisted threat detection will augment, not replace, human analysts – making strong foundational skills in log analysis and framework mapping even more critical.
- -1 Organizations that neglect continuous SOC training will face widening detection gaps as attacker TTPs evolve faster than defensive playbooks.
- -1 The retirement of legacy SOC paths (February 2026) means analysts relying on outdated material must rapidly upskill to stay relevant.
▶️ Related Video (72% Match):
🎯Let’s Practice For Free:
🎓 Live Courses & Certifications:
Join Undercode Academy for Verified Certifications
🚀 Request a Custom Project:
Secure, high-velocity infrastructure and disruptive technological engineering. Contact our engineering team for high-tier development and proprietary systems:
[email protected]
💎 Smart Architecture | 🛡️ Secure by Design | ⭐ Trusted by Thousands
IT/Security Reporter URL:
Reported By: Shakib Khan – Hackers Feeds
Extra Hub: Undercode MoN
Basic Verification: Pass ✅


