Listen to this Post
Introduction:
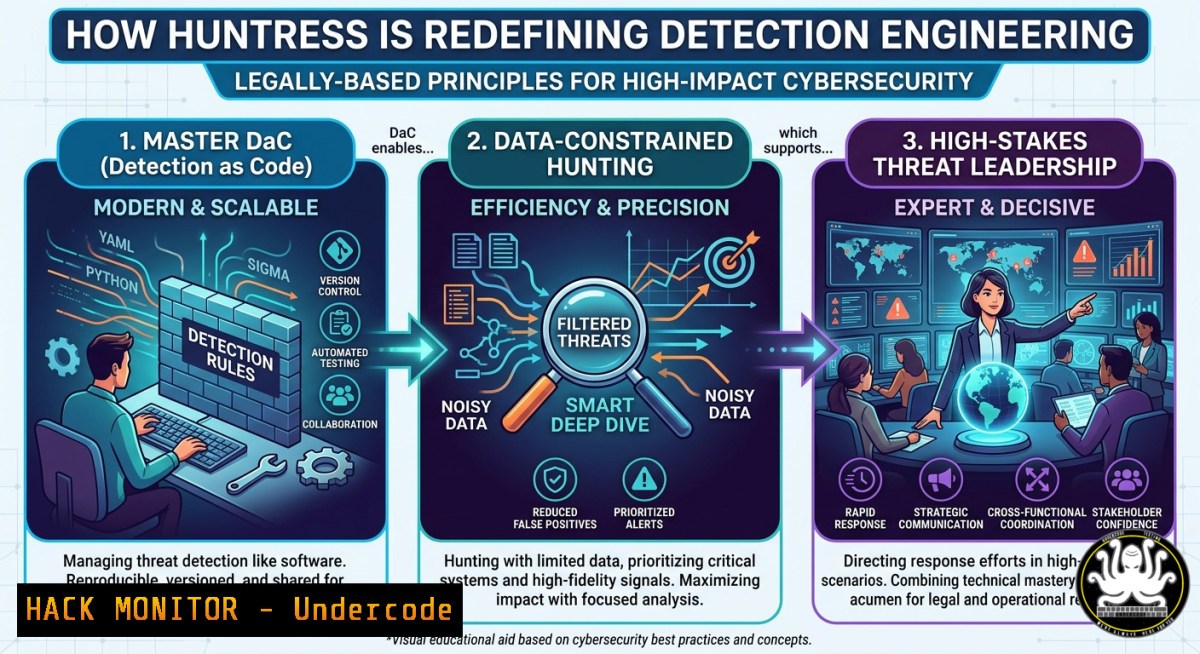
Detection engineering and threat hunting have evolved from reactive alert-tuning into proactive, code-driven defense. As Huntress seeks a manager to lead teams protecting millions of users, the role demands fluency in Detection as Code (DaC), performance monitoring under data-constrained environments, and product development thinking—blending engineering rigor with adversary pursuit. This article unpacks the technical stacks, command-line tactics, and leadership strategies required to excel in modern detection operations.
Learning Objectives:
- Build and maintain a Detection as Code (DaC) pipeline using version-controlled Sigma rules and automated testing.
- Execute threat hunting queries in data-constrained environments (e.g., limited logging, high-throughput telemetry) with efficient KQL and SQL patterns.
- Optimize detection engine performance via Linux perf, Windows ETW, and cloud-based monitoring tools.
You Should Know:
- Detection as Code (DaC) Pipeline for Collaborative Threat Content
Detection as Code treats detection logic (Sigma, YARA, or custom rules) like software—versioned, peer-reviewed, and CI/CD tested. Huntress’s unique instrumentation requires managers to lead domain experts through this paradigm.
Step‑by‑step guide explaining what this does and how to use it:
– Initialize a Git repo for detection content: `mkdir huntress-detections && cd huntress-detections && git init`
– Create Sigma rule directory structure: `mkdir -p rules/windows/process_creation rules/linux`
– Write a sample Sigma rule (rules/windows/process_creation/proc_access_lsass.yml):
title: Suspicious LSASS Access
status: experimental
logsource:
product: windows
service: sysmon
detection:
selection:
EventID: 10
TargetImage|endswith: '\lsass.exe'
CallTrace|contains: 'dbghelp.dll'
condition: selection
– Automate validation using `sigmac` (Sigma compiler): `sigmac -t splunk rules/windows/process_creation/ -c tools/config/winlogbeat.yml –validate`
– Integrate into CI/CD (GitHub Actions) – test rule against sample EVTX logs. Example action step:
- name: Validate Sigma rules
run: |
for rule in rules//.yml; do
sigmac -t json $rule --backend-option output=stdout > /dev/null
done
– Deploy rules via Ansible or Terraform to SIEM (e.g., Sentinel, Splunk ES). Use `curl` to push via API:
curl -X POST "https://your-siem/api/rules" -H "Authorization: Bearer $TOKEN" -d @rule.json
2. Hunting in Data‑Constrained Environments (Low‑Bandwidth, Ephemeral Telemetry)
When you cannot log everything, prioritize high‑value artifacts and use streaming analytics. Huntress protects millions with constrained data—managers must design hunts that work on 10% sample rates or edge devices.
Step‑by‑step guide explaining what this does and how to use it:
– Identify constrained environment (e.g., IoT, OT, or low‑storage endpoints). Use `df -h` (Linux) or `Get-PSDrive` (Windows) to assess available log space.
– Implement targeted event collection on Linux with `auditd` – only monitor execve and file writes:
sudo auditctl -a always,exit -F arch=b64 -S execve -k process_exec
sudo auditctl -a always,exit -F arch=b64 -S openat -F success=1 -k file_access
– Forward only anomalies using `fail2ban` style aggregation – script to send alerts on high‑entropy command lines:
 stream_anomaly.py
import subprocess, json
for line in subprocess.Popen(['tail','-f','/var/log/audit/audit.log'], stdout=subprocess.PIPE).stdout:
if "execve" in line and len(line.split()) > 20:
send_alert(json.dumps({"raw": line}))
– Use KQL (Kusto Query Language) with sampling – instead of `| where…` over full table, use `sample` and `take` to limit data:
Heartbeat | where TimeGenerated > ago(1d) | sample 1000 | project Computer, OSType
– Performance monitor your hunter’s queries – log query execution time and cardinality. Use `SET query_timeout = 300;` in ClickHouse or `SET statement_timeout = ‘5min’` in PostgreSQL for analytic DBs.
- Performance Monitoring of Detection Engines (Linux & Windows)
Detection managers must prevent rule bloat from tanking endpoint sensors or SIEM ingest. Useperf, ETW, and Prometheus metrics.
Step‑by‑step guide explaining what this does and how to use it:
– Linux: profile CPU usage of a detection agent (e.g., osquery, Falco):
sudo perf top -p $(pidof osqueryd)  real-time view
sudo perf record -e cycles -ag -- sleep 30 && sudo perf report
– Windows: measure ETW provider impact using `logman` and tracerpt:
logman start "DetectPerf" -p Microsoft-Windows-Sysmon 5 -o c:\traces\sysmon.etl -ets
timeout /t 60
logman stop "DetectPerf" -ets
tracerpt c:\traces\sysmon.etl -o c:\reports\sysmon_report.xml
– Create Prometheus metrics for rule latency – export how many milliseconds per event per rule:
 In detection engine config
metrics:
enabled: true
port: 9090
rule_latency_histogram: true
– Set alert on rule latency > 100ms using PromQL:
`histogram_quantile(0.95, rate(rule_latency_seconds_bucket
)) > 0.1`</h2>

<ul>
<li>Tune or deprecate slow rules – move from live to batch analytics.</li>
</ul>

<h2 style="color: yellow;">4. Linux Command Line Threat Hunting (Live Response)</h2>

Huntress’s managers need to guide teams through live memory and filesystem analysis on compromised Linux hosts.

Step‑by‑step guide explaining what this does and how to use it:
- Identify anomalous processes using `ps` with custom output:
[bash]
ps -eo pid,cmd,pcpu,pmem,etime --sort=-pcpu | head -20
– Check hidden or deleted file handles:
sudo lsof +L1 | grep deleted
– Examine kernel module anomalies:
lsmod | grep -v -e "^Module" -e "^ " | awk '{print $1}' | xargs modinfo | grep -E "filename|signer"
– Search for command-line obfuscation (base64, double quotes):
grep -E 'echo.base64|sh.-c|curl.|.sh' /var/log/auth.log /var/log/syslog
– Use `auditd` to replay past activity:
sudo ausearch -i -k process_exec --start recent --end now
5. Windows PowerShell Hunting for Artifact Collection
In Windows-heavy environments, use native PowerShell to find lateral movement and persistence without agents.
Step‑by‑step guide explaining what this does and how to use it:
– Collect scheduled tasks for anomalies:
Get-ScheduledTask | Where-Object {$<em>.Actions.Execute -like "powershell" -or $</em>.Triggers -like "OnStart"} | Format-Table TaskName, State, Actions
– Extract WMI event consumers (common persistence):
Get-WmiObject -Namespace root\subscription -Class __FilterToConsumerBinding | Select-Object Filter, Consumer
– Check for unusual service binary paths:
Get-Service | Where-Object {$<em>.StartType -ne 'Disabled' -and $</em>.PathName -match 'Temp|Users|Public'} | Select-Object Name, PathName
– Monitor PowerShell script block logs (enabled via Group Policy):
Get-WinEvent -FilterHashtable @{LogName='Microsoft-Windows-PowerShell/Operational'; ID=4104} | Where-Object {$_.Message -match '-EncodedCommand|IEX'} | Select-Object TimeCreated, Message
– Use Sysinternals autoruns for lightweight hunting:
autorunsc64.exe -a -c -nobanner > autoruns.csv
6. Cloud Hardening for Detection Visibility (AWS/Azure)
Detection engineering extends to cloud control planes. Apply these hardening steps to ensure you can hunt in cloud logs.
Step‑by‑step guide explaining what this does and how to use it:
– Enable AWS GuardDuty and export findings to SIEM:
aws guardduty create-detector --enable --finding-publishing-frequency FIFTEEN_MINUTES
aws guardduty list-findings --detector-id <detectorId> --max-results 10
– Configure S3 server access logging for anomaly detection on bucket enumeration:
aws s3api put-bucket-logging --bucket my-bucket --bucket-logging-status file://logging.json
– Azure: enable diagnostic settings for all subscriptions using PowerShell:
$subscription = Get-AzSubscription -SubscriptionName "HuntressProd"
Set-AzContext -Subscription $subscription
$logAnalytics = Get-AzOperationalInsightsWorkspace -Name "huntress-la"
Set-AzDiagnosticSetting -ResourceId $subscription.Id -WorkspaceId $logAnalytics.ResourceId -Enabled $true -Category "Audit","Security"
– Monitor for privilege escalation via cloud role assignments – KQL example:
AzureActivity
| where OperationNameValue contains "Microsoft.Authorization/roleAssignments/write"
| where ActivityStatusValue == "Success"
| extend Role = tostring(parse_json(Properties).roleDefinitionId)
| summarize by Caller, TimeGenerated, Role
- Mitigating & Exploiting Common Detection Gaps (Adversary Simulation)
To lead threat hunting, you must think like an attacker exploiting telemetry gaps.
Step‑by‑step guide explaining what this does and how to use it:
– Simulate process hollowing (Linux memory injection) – detection: lack of `execve` logs:
// compile with gcc -o hollow hollow.c; use ptrace to inject shellcode
// Mitigation: monitor `ptrace` usage via auditd: -S ptrace
– Exploit data-constrained environment by log flooding – to test resilience:
for i in {1..100000}; do logger "Benign fill $i"; done
– Mitigation: implement rate‑limiting on log forwarders (Fluent Bit config):
[bash]
Name throttle
Match
Rate 1000
Window 5
– Use EDR evasion via unhooking syscalls – detection: enforce kernel‑callbacks like eBPF or Windows PsSetCreateProcessNotifyRoutine.
– Write a Sigma rule for direct syscall indicators (unusual syscall table modifications). Example detection logic:
detection:
selection:
EventID: 1
Image|contains: 'python'
CommandLine|contains: 'ctypes.CDLL'
condition: selection
What Undercode Say:
- Key Takeaway 1: True detection leadership fuses software engineering (DaC, CI/CD, performance metrics) with adversarial intuition—managers must review both pull requests and PCAPs.
- Key Takeaway 2: Data‑constrained environments are not limitations but design drivers; the most creative hunts happen when you can’t log everything, forcing prioritization of high‑signal artifacts.
- Analysis: The Huntress hiring post reveals an industry shift: detection engineering is now a product discipline. The mention of “unique instrumentation” implies proprietary telemetry—so managers must balance exploitation of that data with generalization across diverse customer environments. “Supervisory challenges of domain experts” highlights the difficulty of leading former red‑teamers or incident responders who resist process. The expectation of “consequential work” means false negatives literally endanger millions, demanding rigorous testing (e.g., chaos engineering for detection rules). Future roles will require certifications like GIAC GDSA (for cloud detection) and hands‑on with eBPF and Windows Event Tracing. The comments (“sweet team name alone”) show culture matters—branding detection as “hunting” attracts top talent.
Prediction:
By 2028, detection engineering manager roles will split into two tracks: one focused on AI‑generated rule recommendations (prompt engineering for SIEMs) and another on bare‑metal instrumentation for air‑gapped environments. As Huntress and peers scale, DaC will become mandatory for SOC compliance (ISO 27001:2026 likely includes code‑reviewed detection). Data‑constrained hunting will spawn new open‑source tools resembling “mini‑Sigma” for embedded devices. Managers who cannot script their own performance benchmarks or query cloud audit logs will be displaced by hybrid leader‑engineers. The future of threat hunting is not more logs—it’s smarter, faster, and cheaper detection, exactly as Huntress’s “unique instrumentation” promises.
▶️ Related Video (80% Match):
🎯Let’s Practice For Free:
IT/Security Reporter URL:
Reported By: Devonkerr Hiring – Hackers Feeds
Extra Hub: Undercode MoN
Basic Verification: Pass ✅


