Listen to this Post
Introduction:
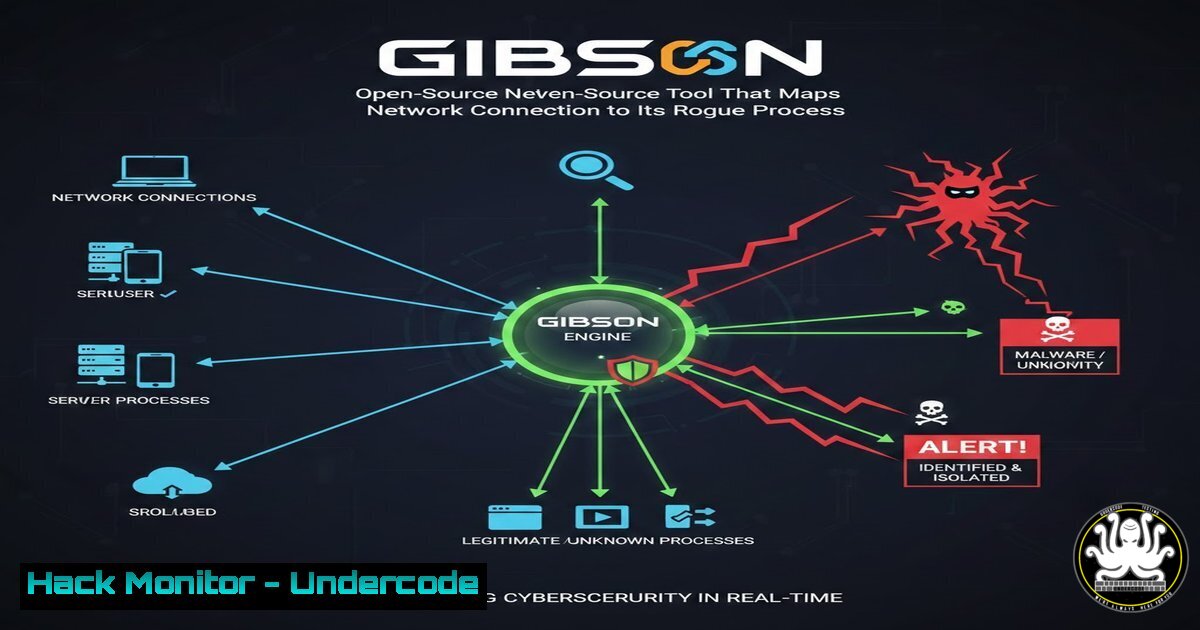
In the fog of a security operations center, a common blind spot persists: knowing a connection exists, but not knowing which process spawned it. Standard netstat commands reveal IP addresses and ports, but they divorce the network layer from the endpoint context. Gibson, a new open-source threat-hunting tool, bridges this gap by mapping outbound network flows directly to their parent processes, enabling defenders to spot beaconing, unauthorized cloud usage, and potential command-and-control (C2) traffic with surgical precision.
Learning Objectives:
- Understand how to deploy and configure Gibson to collect process-to-network mapping data.
- Analyze collected network flows to identify anomalous beaconing patterns and unauthorized cloud provider communications.
- Learn to generate and implement firewall rules based on real-time behavioral analysis.
You Should Know:
- Deploying the Gibson Agent for Process-Level Network Visibility
Gibson operates on a lightweight client-server model. A small agent runs on monitored endpoints, capturing network connections as they occur and enriching them with process metadata. This data is then streamed to a central server for correlation and analysis.
Step-by-step guide to deploying the Gibson agent:
- Download the Agent: Obtain the latest agent binary from the official Gibson repository. It is available for both Linux (x86_64/ARM) and Windows.
Linux download example (adjust URL as per release)
wget https://github.com/[project-repo]/releases/download/v1.0/gibson-agent-linux-amd64 -O gibson-agent
chmod +x gibson-agent
-
Configure the Collector Endpoint: Before running, define the central server’s address. This can be done via a configuration file (
config.yaml) or environment variables.config.yaml server: "https://your-gibson-server:8443" compress: true Enable gzip compression encrypt: true Enable AES-256-GCM encryption cert_path: "/etc/gibson/client.crt" For mutual TLS
Windows users would create a similar `config.yaml` in the agent’s directory.
-
Start the Agent as a Service: For persistent monitoring, run the agent as a system service.
Linux (systemd example)
sudo ./gibson-agent --config /etc/gibson/config.yaml --daemon
On Windows, this could be run as a scheduled task or a Windows Service.
-
Verify Data Stream: The agent will begin capturing connections (TCP/UDP) and sending JSONL (JSON Lines) records. A sample record might look like:
{"timestamp": 1710000000, "pid": 1337, "process": "nc.exe", "user": "SYSTEM", "local_ip": "192.168.1.100", "remote_ip": "45.155.205.233", "remote_port": 4444, "bytes_sent": 1024, "bytes_recv": 512} -
Central Server Analysis: Detecting Beaconing and Cloud Provider Traffic
The Gibson server ingests the JSONL streams from all agents. Its analysis engine then enriches the data with ASN and cloud provider information (AWS, Azure, GCP, Cloudflare) and runs statistical analysis to detect beaconing patterns—regular, periodic connections indicative of C2 heartbeat traffic.
Step-by-step guide to analyzing collected data:
- Start the Gibson Server: The server component listens for agent connections, decrypts/decompresses the streams, and stores them.
./gibson-server --listen :8443 --tls-cert server.crt --tls-key server.key --db-path ./gibson.db
-
Query for Cloud Provider Connections: Use the built-in SQL export or CLI to find processes communicating with known cloud IPs. This can reveal shadow IT or a compromised application exfiltrating data to a personal cloud account.
-- Example query run against the exported SQLite database SELECT process, COUNT() as connections, remote_ip, cloud_provider FROM network_flows WHERE cloud_provider IN ('AWS', 'AZURE', 'GCP') GROUP BY process, remote_ip ORDER BY connections DESC; -
Identify Beaconing Behavior: The server can flag processes with connections that occur at highly regular intervals. For a manual deep dive using command-line tools, you can export data and use `jq` and `awk` to analyze periodicity.
Export JSONL for a specific suspicious process
grep '"process":"nc.exe"' /var/log/gibson/streams/.jsonl > nc_traffic.jsonl

Extract timestamps and look for consistent intervals
jq '.timestamp' nc_traffic.jsonl | awk '{print $1 - prev; prev=$1}' | sort | uniq -c
A result showing many connections with a 60-second interval (e.g.,
60) strongly suggests beaconing.
3. Cross-Machine Correlation and Threat Hunting
Gibson’s power multiplies when data from multiple hosts is aggregated. A single host connecting to an unknown IP might be an anomaly; five hosts connecting to the same unknown IP at similar intervals is a strong indicator of a coordinated compromise.
Step-by-step guide to cross-machine hunting:
- Aggregate by Remote IP: From the Gibson server’s database, identify remote IPs that appear in flows from more than a threshold number of distinct hosts.
SELECT remote_ip, COUNT(DISTINCT hostname) as host_count, GROUP_CONCAT(DISTINCT process) as processes
FROM network_flows
GROUP BY remote_ip
HAVING host_count > 3;
-
Analyze Common Process Names: Look for a specific process name (e.g., `svchost.exe` behaving oddly, or a uniquely named binary) that appears across multiple hosts communicating with the same suspicious external IP.
Using gibson-cli tool (hypothetical)
gibson-cli hunt --remote-ip 45.155.205.233 --show-processes --unique-hosts
-
Temporal Correlation: Overlay the connection timelines from different hosts to see if the beaconing is synchronized. This could indicate a C2 channel that checks in simultaneously after a predefined schedule or command.
-
Automating Defense: Generating Firewall Rules from Threat Data
The final step in the Gibson workflow is moving from detection to prevention. The tool can automatically generate precise firewall rules (iptables for Linux, Windows Firewall rules) to block the malicious communication paths it discovers.
Step-by-step guide to generating and applying firewall rules:
- Flag a Malicious Process: Once a process, like `nc.exe` on a Windows host, is confirmed as malicious, the analyst marks it in the Gibson interface.
-
Generate iptables Rule (Linux): Gibson can output a specific rule to block all outbound traffic from that process’s PID or, more persistently, based on its executable path using `owner` module matching.
Generated iptables command
iptables -A OUTPUT -m owner --comm-match "nc.exe" -j DROP
Note: `comm-match` matches the process command name. For a full path match, you might need more complex integration with `iptables` and `cgroups` or use eBPF-based tools.
-
Generate Windows Firewall Rule (Windows): For Windows endpoints, Gibson can generate PowerShell commands to create a blocking rule.
Generated PowerShell command (run as Administrator)
New-NetFirewallRule -DisplayName "Block nc.exe C2" -Direction Outbound -Program "%SystemRoot%\System32\nc.exe" -Action Block
-
Hunting for Living-off-the-Land Binaries and Anomalous Parent-Child Relationships
Beyond simple beaconing, Gibson’s process context allows for advanced hunting based on process behavior, such as a Microsoft Word instance spawning `powershell.exe` which then makes a network connection.
Step-by-step guide to hunting LOLBins:
- Monitor Process Trees: Gibson can be configured to include parent process IDs (PPID) in its JSONL stream. This allows analysts to reconstruct the process tree.
-
Query for Unusual Parent-Child Flows: Search for network connections initiated by processes that are typically not network-facing.
-- Find all network connections where the parent process is a document editor SELECT child.process, child.remote_ip, parent.process as parent_process FROM network_flows child JOIN processes parent ON child.ppid = parent.pid WHERE parent.process IN ('WINWORD.EXE', 'EXCEL.EXE', 'AcroRd32.exe'); -
Correlate with Sysmon (Optional): For deeper visibility, integrate Gibson’s output with Sysmon Event ID 3 (Network connection) on Windows. The JSONL stream can be enriched with Sysmon’s detailed event data for even more granular analysis.
What Undercode Say:
- Context is King: Gibson transforms raw network logs into actionable intelligence by anchoring them to the endpoint process. This shift from network-centric to process-centric visibility is essential for modern threat hunting.
- Automated Defense Loop: The tool’s ability to automatically generate firewall rules from detected threats creates a rapid feedback loop, moving from “we have a problem” to “the problem is contained” in minutes, not hours.
This tool exemplifies the evolution of detection engineering. By focusing on the “who” (the process) behind the “what” (the connection), it empowers blue teams to cut through the noise of volumetric network data and pinpoint the subtle signals of a compromise, whether it’s a stealthy beacon or an anomalous cloud data transfer.
Prediction:
Gibson’s approach will likely be integrated into next-generation EDR and XDR platforms, shifting focus toward cross-host behavioral analytics. As machine learning models become more sophisticated, they will be trained on the rich process-to-network datasets that tools like Gibson provide, leading to automated detection of novel C2 patterns and a significant reduction in time-to-response for multi-host intrusions. We can also anticipate the rise of community-driven threat intelligence feeds based on anonymized Gibson telemetry, where patterns of beaconing and malicious IPs are shared in near real-time.
▶️ Related Video (82% Match):
🎯Let’s Practice For Free:
IT/Security Reporter URL:
Reported By: Laurent Biagiotti – Hackers Feeds
Extra Hub: Undercode MoN
Basic Verification: Pass ✅


